Immigrants from Israel vs European Householder Income Ages 45 - 64 years
COMPARE
Immigrants from Israel
European
Householder Income Ages 45 - 64 years
Householder Income Ages 45 - 64 years Comparison
Immigrants from Israel
Europeans
$122,893
HOUSEHOLDER INCOME AGES 45 - 64 YEARS
100.0/ 100
METRIC RATING
12th/ 347
METRIC RANK
$106,367
HOUSEHOLDER INCOME AGES 45 - 64 YEARS
95.4/ 100
METRIC RATING
113th/ 347
METRIC RANK
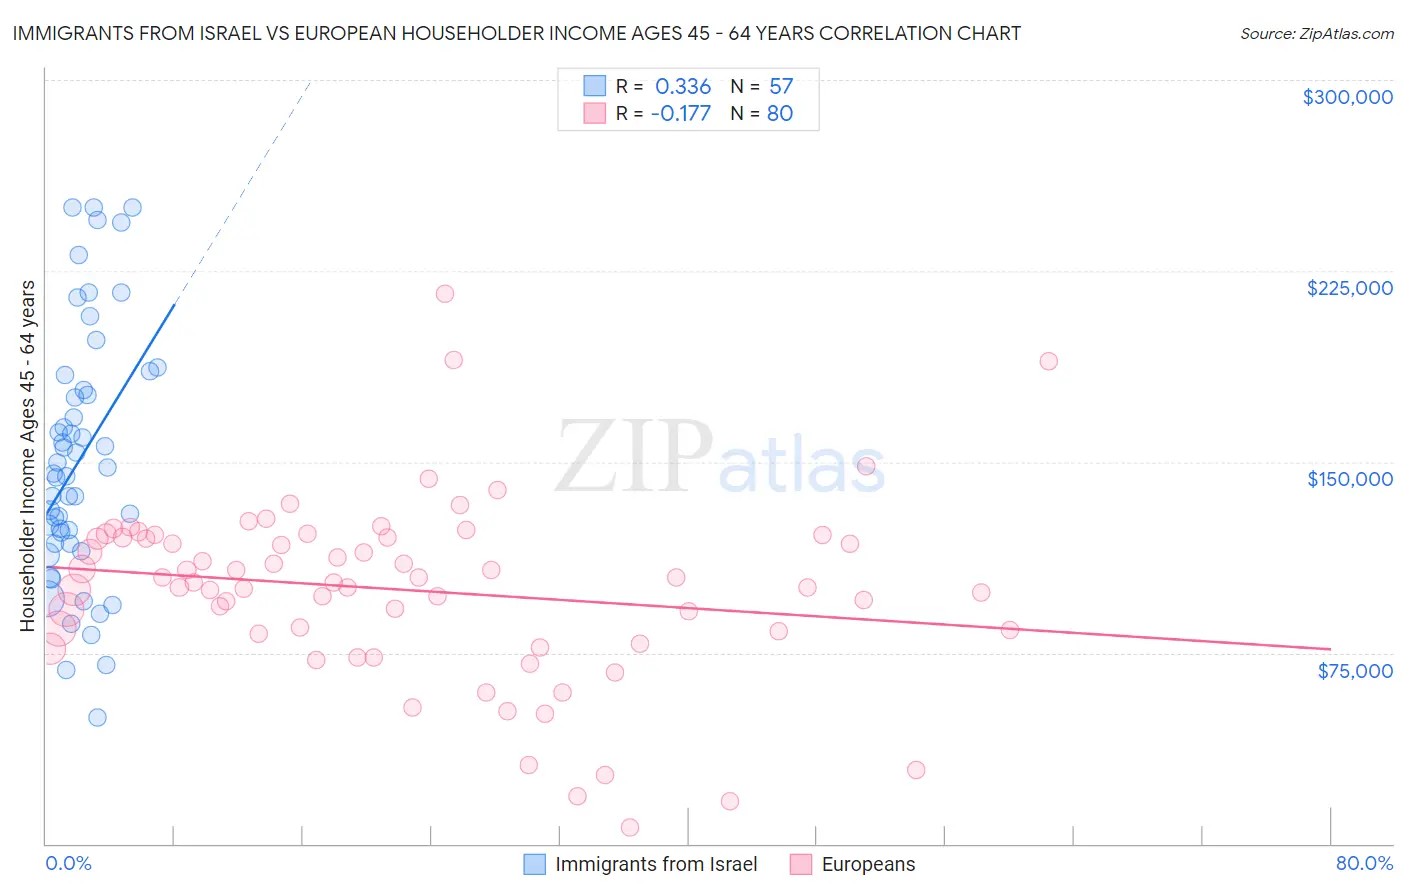
Immigrants from Israel vs European Householder Income Ages 45 - 64 years Correlation Chart
The statistical analysis conducted on geographies consisting of 209,875,627 people shows a mild positive correlation between the proportion of Immigrants from Israel and household income with householder between the ages 45 and 64 in the United States with a correlation coefficient (R) of 0.336 and weighted average of $122,893. Similarly, the statistical analysis conducted on geographies consisting of 558,626,561 people shows a poor negative correlation between the proportion of Europeans and household income with householder between the ages 45 and 64 in the United States with a correlation coefficient (R) of -0.177 and weighted average of $106,367, a difference of 15.5%.
Householder Income Ages 45 - 64 years Correlation Summary
| Measurement | Immigrants from Israel | European |
| Minimum | $49,413 | $6,604 |
| Maximum | $250,001 | $216,139 |
| Range | $200,588 | $209,535 |
| Mean | $150,945 | $99,691 |
| Median | $145,254 | $102,766 |
| Interquartile 25% (IQ1) | $117,950 | $82,969 |
| Interquartile 75% (IQ3) | $181,200 | $120,255 |
| Interquartile Range (IQR) | $63,250 | $37,286 |
| Standard Deviation (Sample) | $49,727 | $35,975 |
| Standard Deviation (Population) | $49,289 | $35,750 |
Similar Demographics by Householder Income Ages 45 - 64 years
Demographics Similar to Immigrants from Israel by Householder Income Ages 45 - 64 years
In terms of householder income ages 45 - 64 years, the demographic groups most similar to Immigrants from Israel are Immigrants from Ireland ($122,757, a difference of 0.11%), Cypriot ($123,396, a difference of 0.41%), Indian (Asian) ($122,343, a difference of 0.45%), Immigrants from Eastern Asia ($122,222, a difference of 0.55%), and Immigrants from China ($122,178, a difference of 0.59%).
| Demographics | Rating | Rank | Householder Income Ages 45 - 64 years |
| Immigrants | Singapore | 100.0 /100 | #5 | Exceptional $129,514 |
| Iranians | 100.0 /100 | #6 | Exceptional $129,350 |
| Immigrants | Hong Kong | 100.0 /100 | #7 | Exceptional $127,500 |
| Immigrants | Iran | 100.0 /100 | #8 | Exceptional $126,940 |
| Okinawans | 100.0 /100 | #9 | Exceptional $124,796 |
| Immigrants | South Central Asia | 100.0 /100 | #10 | Exceptional $124,188 |
| Cypriots | 100.0 /100 | #11 | Exceptional $123,396 |
| Immigrants | Israel | 100.0 /100 | #12 | Exceptional $122,893 |
| Immigrants | Ireland | 100.0 /100 | #13 | Exceptional $122,757 |
| Indians (Asian) | 100.0 /100 | #14 | Exceptional $122,343 |
| Immigrants | Eastern Asia | 100.0 /100 | #15 | Exceptional $122,222 |
| Immigrants | China | 100.0 /100 | #16 | Exceptional $122,178 |
| Burmese | 100.0 /100 | #17 | Exceptional $121,444 |
| Immigrants | Korea | 100.0 /100 | #18 | Exceptional $121,243 |
| Eastern Europeans | 100.0 /100 | #19 | Exceptional $120,684 |
Demographics Similar to Europeans by Householder Income Ages 45 - 64 years
In terms of householder income ages 45 - 64 years, the demographic groups most similar to Europeans are Swedish ($106,377, a difference of 0.010%), Immigrants from Vietnam ($106,417, a difference of 0.050%), Immigrants from Poland ($106,319, a difference of 0.050%), Immigrants from Kuwait ($106,285, a difference of 0.080%), and Immigrants from Brazil ($106,470, a difference of 0.10%).
| Demographics | Rating | Rank | Householder Income Ages 45 - 64 years |
| Armenians | 96.6 /100 | #106 | Exceptional $107,002 |
| Immigrants | Fiji | 96.5 /100 | #107 | Exceptional $106,952 |
| Zimbabweans | 96.3 /100 | #108 | Exceptional $106,849 |
| Chileans | 95.9 /100 | #109 | Exceptional $106,611 |
| Immigrants | Brazil | 95.6 /100 | #110 | Exceptional $106,470 |
| Immigrants | Vietnam | 95.5 /100 | #111 | Exceptional $106,417 |
| Swedes | 95.4 /100 | #112 | Exceptional $106,377 |
| Europeans | 95.4 /100 | #113 | Exceptional $106,367 |
| Immigrants | Poland | 95.3 /100 | #114 | Exceptional $106,319 |
| Immigrants | Kuwait | 95.2 /100 | #115 | Exceptional $106,285 |
| British | 95.2 /100 | #116 | Exceptional $106,264 |
| Albanians | 95.1 /100 | #117 | Exceptional $106,243 |
| Immigrants | Western Asia | 95.0 /100 | #118 | Exceptional $106,217 |
| Immigrants | Jordan | 94.9 /100 | #119 | Exceptional $106,164 |
| Immigrants | South Eastern Asia | 94.8 /100 | #120 | Exceptional $106,109 |