Mongolian vs European Married-couple Households
COMPARE
Mongolian
European
Married-couple Households
Married-couple Households Comparison
Mongolians
Europeans
46.3%
MARRIED-COUPLE HOUSEHOLDS
42.0/ 100
METRIC RATING
180th/ 347
METRIC RANK
49.6%
MARRIED-COUPLE HOUSEHOLDS
99.9/ 100
METRIC RATING
19th/ 347
METRIC RANK
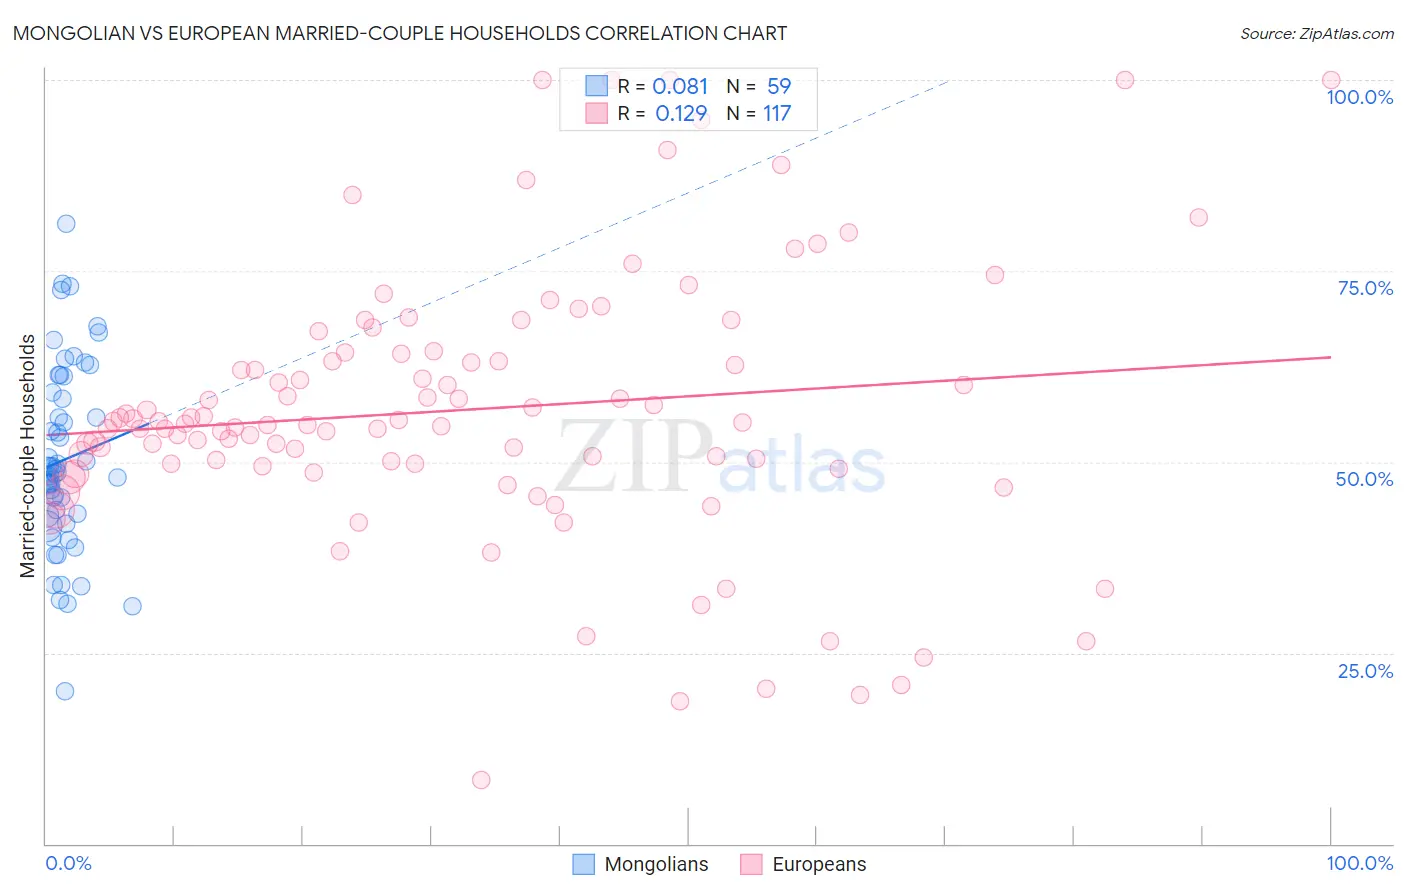
Mongolian vs European Married-couple Households Correlation Chart
The statistical analysis conducted on geographies consisting of 140,286,033 people shows a slight positive correlation between the proportion of Mongolians and percentage of married-couple family households in the United States with a correlation coefficient (R) of 0.081 and weighted average of 46.3%. Similarly, the statistical analysis conducted on geographies consisting of 561,207,916 people shows a poor positive correlation between the proportion of Europeans and percentage of married-couple family households in the United States with a correlation coefficient (R) of 0.129 and weighted average of 49.6%, a difference of 7.0%.
Married-couple Households Correlation Summary
| Measurement | Mongolian | European |
| Minimum | 20.0% | 8.3% |
| Maximum | 81.2% | 100.0% |
| Range | 61.2% | 91.7% |
| Mean | 50.3% | 56.8% |
| Median | 48.6% | 54.9% |
| Interquartile 25% (IQ1) | 43.0% | 49.6% |
| Interquartile 75% (IQ3) | 59.1% | 64.2% |
| Interquartile Range (IQR) | 16.1% | 14.6% |
| Standard Deviation (Sample) | 12.1% | 17.7% |
| Standard Deviation (Population) | 12.0% | 17.6% |
Similar Demographics by Married-couple Households
Demographics Similar to Mongolians by Married-couple Households
In terms of married-couple households, the demographic groups most similar to Mongolians are Malaysian (46.3%, a difference of 0.010%), Immigrants from Zimbabwe (46.3%, a difference of 0.040%), Immigrants from Costa Rica (46.3%, a difference of 0.050%), Immigrants (46.3%, a difference of 0.070%), and Cajun (46.4%, a difference of 0.12%).
| Demographics | Rating | Rank | Married-couple Households |
| Immigrants | Norway | 52.0 /100 | #173 | Average 46.5% |
| Immigrants | Mexico | 50.0 /100 | #174 | Average 46.4% |
| Immigrants | Colombia | 46.1 /100 | #175 | Average 46.4% |
| Cajuns | 45.2 /100 | #176 | Average 46.4% |
| Immigrants | Immigrants | 43.8 /100 | #177 | Average 46.3% |
| Immigrants | Costa Rica | 43.4 /100 | #178 | Average 46.3% |
| Immigrants | Zimbabwe | 43.0 /100 | #179 | Average 46.3% |
| Mongolians | 42.0 /100 | #180 | Average 46.3% |
| Malaysians | 41.8 /100 | #181 | Average 46.3% |
| Yugoslavians | 38.9 /100 | #182 | Fair 46.2% |
| Immigrants | Brazil | 38.3 /100 | #183 | Fair 46.2% |
| Immigrants | Switzerland | 36.9 /100 | #184 | Fair 46.2% |
| Brazilians | 35.9 /100 | #185 | Fair 46.2% |
| Albanians | 31.1 /100 | #186 | Fair 46.1% |
| Fijians | 29.2 /100 | #187 | Fair 46.1% |
Demographics Similar to Europeans by Married-couple Households
In terms of married-couple households, the demographic groups most similar to Europeans are Scandinavian (49.6%, a difference of 0.0%), Norwegian (49.5%, a difference of 0.060%), English (49.6%, a difference of 0.16%), Immigrants from Hong Kong (49.6%, a difference of 0.17%), and Asian (49.5%, a difference of 0.17%).
| Demographics | Rating | Rank | Married-couple Households |
| Swiss | 100.0 /100 | #12 | Exceptional 49.9% |
| Immigrants | Korea | 100.0 /100 | #13 | Exceptional 49.9% |
| Burmese | 100.0 /100 | #14 | Exceptional 49.8% |
| Koreans | 99.9 /100 | #15 | Exceptional 49.7% |
| Swedes | 99.9 /100 | #16 | Exceptional 49.7% |
| Immigrants | Hong Kong | 99.9 /100 | #17 | Exceptional 49.6% |
| English | 99.9 /100 | #18 | Exceptional 49.6% |
| Europeans | 99.9 /100 | #19 | Exceptional 49.6% |
| Scandinavians | 99.9 /100 | #20 | Exceptional 49.6% |
| Norwegians | 99.9 /100 | #21 | Exceptional 49.5% |
| Asians | 99.9 /100 | #22 | Exceptional 49.5% |
| Dutch | 99.9 /100 | #23 | Exceptional 49.5% |
| Czechs | 99.9 /100 | #24 | Exceptional 49.4% |
| Immigrants | Philippines | 99.9 /100 | #25 | Exceptional 49.3% |
| Immigrants | Scotland | 99.8 /100 | #26 | Exceptional 49.3% |