Immigrants from Guyana vs Australian Births to Unmarried Women
COMPARE
Immigrants from Guyana
Australian
Births to Unmarried Women
Births to Unmarried Women Comparison
Immigrants from Guyana
Australians
35.0%
BIRTHS TO UNMARRIED WOMEN
1.2/ 100
METRIC RATING
241st/ 347
METRIC RANK
29.5%
BIRTHS TO UNMARRIED WOMEN
94.6/ 100
METRIC RATING
102nd/ 347
METRIC RANK
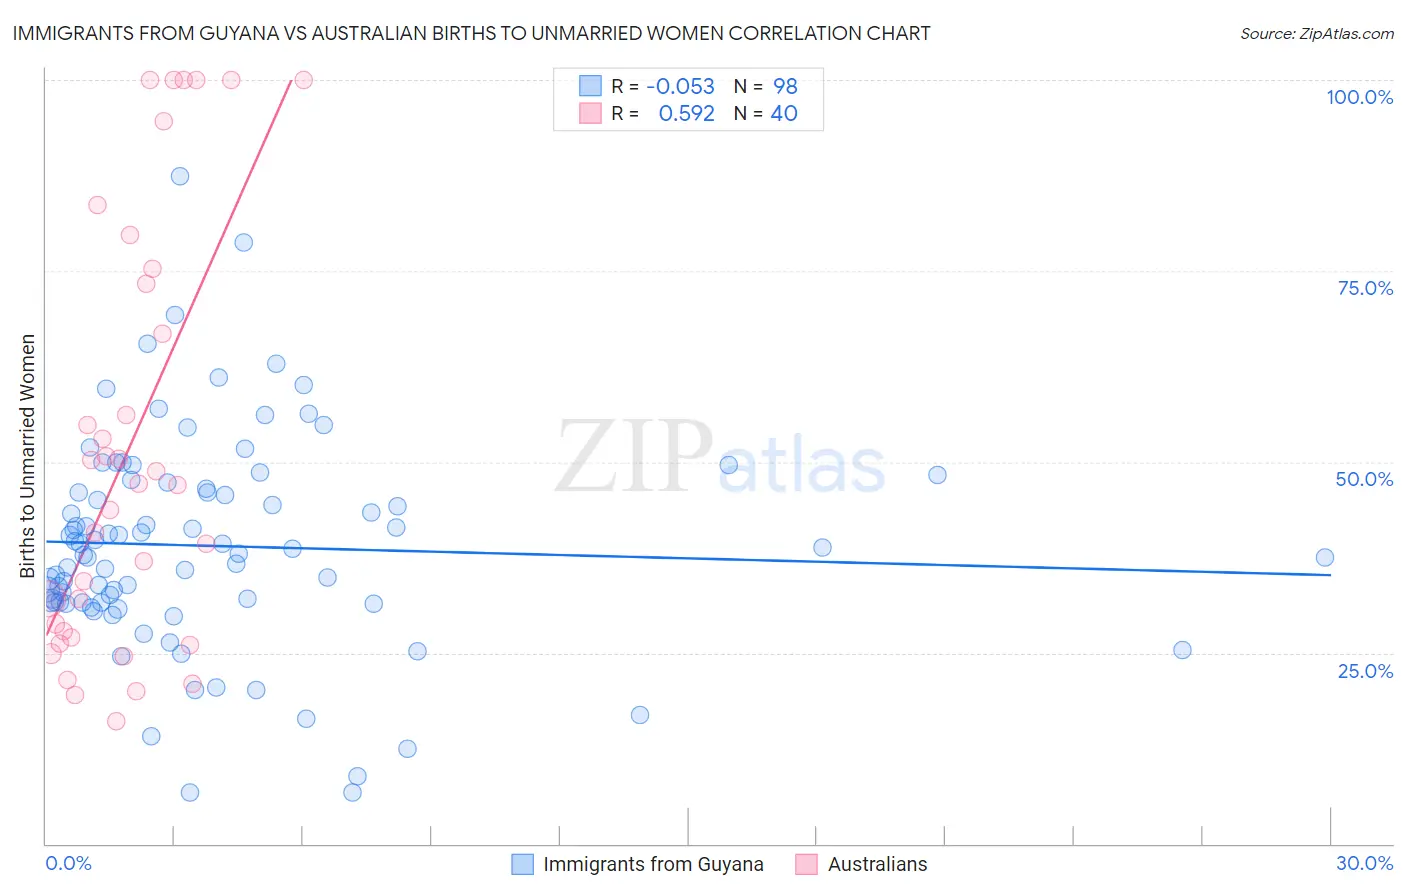
Immigrants from Guyana vs Australian Births to Unmarried Women Correlation Chart
The statistical analysis conducted on geographies consisting of 177,005,491 people shows a slight negative correlation between the proportion of Immigrants from Guyana and percentage of births to unmarried women in the United States with a correlation coefficient (R) of -0.053 and weighted average of 35.0%. Similarly, the statistical analysis conducted on geographies consisting of 212,996,225 people shows a substantial positive correlation between the proportion of Australians and percentage of births to unmarried women in the United States with a correlation coefficient (R) of 0.592 and weighted average of 29.5%, a difference of 18.3%.
Births to Unmarried Women Correlation Summary
| Measurement | Immigrants from Guyana | Australian |
| Minimum | 6.7% | 16.0% |
| Maximum | 87.4% | 100.0% |
| Range | 80.7% | 84.0% |
| Mean | 39.0% | 51.9% |
| Median | 38.4% | 47.1% |
| Interquartile 25% (IQ1) | 31.6% | 27.4% |
| Interquartile 75% (IQ3) | 46.5% | 74.3% |
| Interquartile Range (IQR) | 14.9% | 46.9% |
| Standard Deviation (Sample) | 14.0% | 27.9% |
| Standard Deviation (Population) | 14.0% | 27.5% |
Similar Demographics by Births to Unmarried Women
Demographics Similar to Immigrants from Guyana by Births to Unmarried Women
In terms of births to unmarried women, the demographic groups most similar to Immigrants from Guyana are Immigrants from Middle Africa (34.9%, a difference of 0.030%), Indonesian (35.0%, a difference of 0.10%), Sierra Leonean (34.9%, a difference of 0.28%), Immigrants from Cambodia (34.8%, a difference of 0.51%), and Marshallese (34.8%, a difference of 0.57%).
| Demographics | Rating | Rank | Births to Unmarried Women |
| Immigrants | Zaire | 2.3 /100 | #234 | Tragic 34.5% |
| Immigrants | Ghana | 2.2 /100 | #235 | Tragic 34.5% |
| Immigrants | Cameroon | 1.6 /100 | #236 | Tragic 34.7% |
| Marshallese | 1.6 /100 | #237 | Tragic 34.8% |
| Immigrants | Cambodia | 1.6 /100 | #238 | Tragic 34.8% |
| Sierra Leoneans | 1.4 /100 | #239 | Tragic 34.9% |
| Immigrants | Middle Africa | 1.2 /100 | #240 | Tragic 34.9% |
| Immigrants | Guyana | 1.2 /100 | #241 | Tragic 35.0% |
| Indonesians | 1.2 /100 | #242 | Tragic 35.0% |
| Japanese | 0.9 /100 | #243 | Tragic 35.2% |
| Guyanese | 0.9 /100 | #244 | Tragic 35.2% |
| Shoshone | 0.8 /100 | #245 | Tragic 35.3% |
| Nigerians | 0.7 /100 | #246 | Tragic 35.3% |
| Immigrants | Nigeria | 0.7 /100 | #247 | Tragic 35.4% |
| Immigrants | Nonimmigrants | 0.6 /100 | #248 | Tragic 35.5% |
Demographics Similar to Australians by Births to Unmarried Women
In terms of births to unmarried women, the demographic groups most similar to Australians are Lebanese (29.5%, a difference of 0.050%), Lithuanian (29.6%, a difference of 0.060%), Immigrants from Northern Africa (29.5%, a difference of 0.080%), Immigrants from Nepal (29.6%, a difference of 0.11%), and Immigrants from Denmark (29.4%, a difference of 0.37%).
| Demographics | Rating | Rank | Births to Unmarried Women |
| Immigrants | Vietnam | 96.1 /100 | #95 | Exceptional 29.3% |
| Norwegians | 95.8 /100 | #96 | Exceptional 29.3% |
| Immigrants | South Africa | 95.7 /100 | #97 | Exceptional 29.3% |
| Immigrants | Syria | 95.7 /100 | #98 | Exceptional 29.4% |
| Immigrants | Denmark | 95.3 /100 | #99 | Exceptional 29.4% |
| Luxembourgers | 95.2 /100 | #100 | Exceptional 29.4% |
| Immigrants | Northern Africa | 94.7 /100 | #101 | Exceptional 29.5% |
| Australians | 94.6 /100 | #102 | Exceptional 29.5% |
| Lebanese | 94.4 /100 | #103 | Exceptional 29.5% |
| Lithuanians | 94.4 /100 | #104 | Exceptional 29.6% |
| Immigrants | Nepal | 94.3 /100 | #105 | Exceptional 29.6% |
| Swedes | 93.8 /100 | #106 | Exceptional 29.6% |
| Immigrants | Brazil | 93.7 /100 | #107 | Exceptional 29.6% |
| Paraguayans | 93.5 /100 | #108 | Exceptional 29.7% |
| Greeks | 93.4 /100 | #109 | Exceptional 29.7% |