Immigrants from Grenada vs Haitian Average Family Size
COMPARE
Immigrants from Grenada
Haitian
Average Family Size
Average Family Size Comparison
Immigrants from Grenada
Haitians
3.34
AVERAGE FAMILY SIZE
100.0/ 100
METRIC RATING
62nd/ 347
METRIC RANK
3.37
AVERAGE FAMILY SIZE
100.0/ 100
METRIC RATING
46th/ 347
METRIC RANK
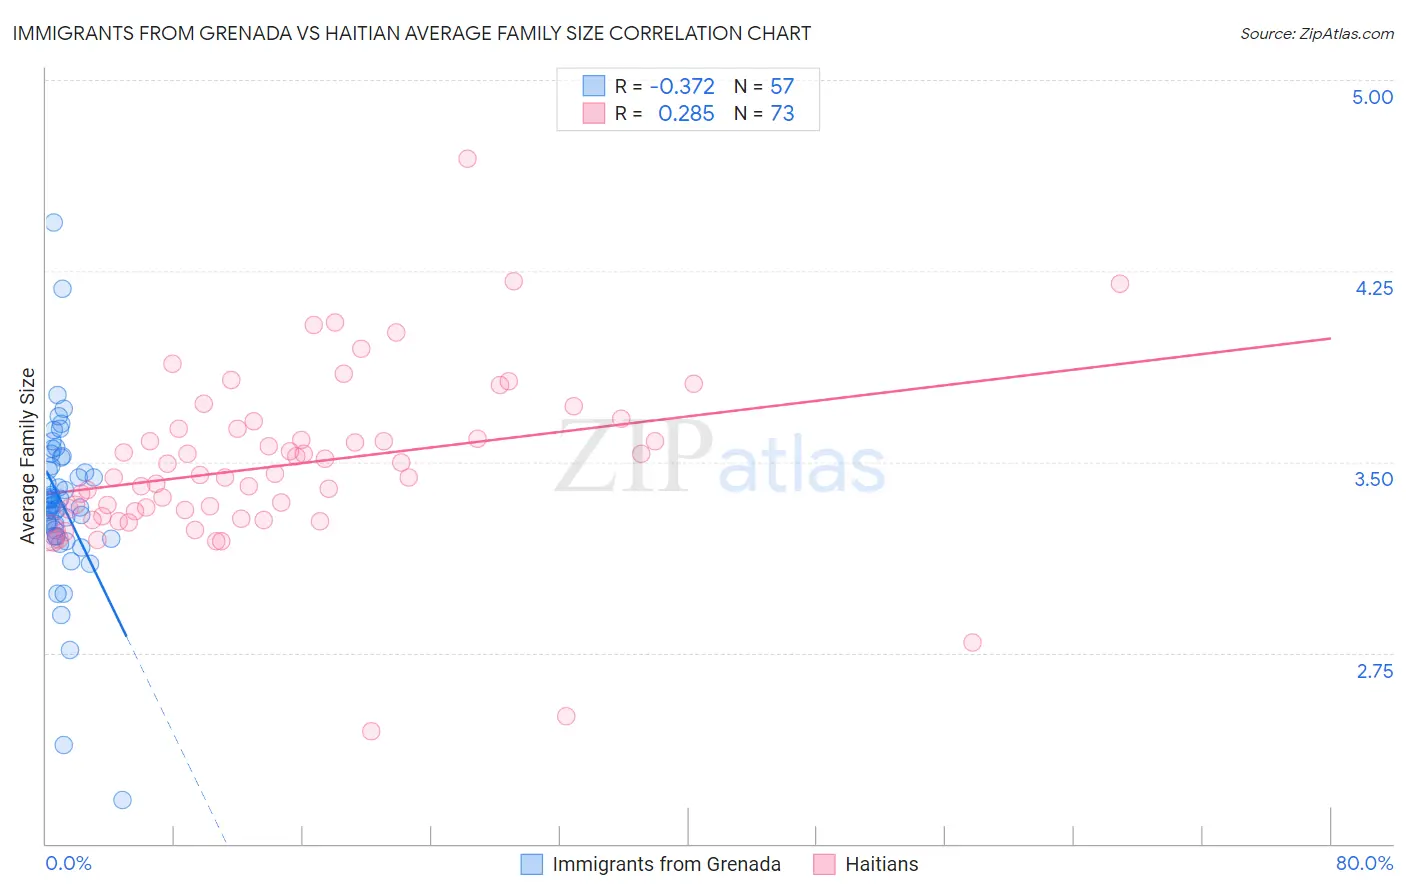
Immigrants from Grenada vs Haitian Average Family Size Correlation Chart
The statistical analysis conducted on geographies consisting of 67,189,874 people shows a mild negative correlation between the proportion of Immigrants from Grenada and average family size in the United States with a correlation coefficient (R) of -0.372 and weighted average of 3.34. Similarly, the statistical analysis conducted on geographies consisting of 287,712,478 people shows a weak positive correlation between the proportion of Haitians and average family size in the United States with a correlation coefficient (R) of 0.285 and weighted average of 3.37, a difference of 0.92%.
Average Family Size Correlation Summary
| Measurement | Immigrants from Grenada | Haitian |
| Minimum | 2.17 | 2.44 |
| Maximum | 4.44 | 4.69 |
| Range | 2.27 | 2.25 |
| Mean | 3.34 | 3.49 |
| Median | 3.33 | 3.45 |
| Interquartile 25% (IQ1) | 3.21 | 3.30 |
| Interquartile 75% (IQ3) | 3.50 | 3.63 |
| Interquartile Range (IQR) | 0.29 | 0.33 |
| Standard Deviation (Sample) | 0.34 | 0.34 |
| Standard Deviation (Population) | 0.33 | 0.34 |
Demographics Similar to Immigrants from Grenada and Haitians by Average Family Size
In terms of average family size, the demographic groups most similar to Immigrants from Grenada are Chinese (3.34, a difference of 0.020%), Dominican (3.34, a difference of 0.090%), Central American Indian (3.35, a difference of 0.19%), Immigrants from Armenia (3.35, a difference of 0.21%), and Japanese (3.35, a difference of 0.24%). Similarly, the demographic groups most similar to Haitians are Vietnamese (3.37, a difference of 0.040%), Immigrants from Nicaragua (3.37, a difference of 0.040%), Shoshone (3.37, a difference of 0.060%), Alaska Native (3.37, a difference of 0.090%), and Bangladeshi (3.37, a difference of 0.11%).
| Demographics | Rating | Rank | Average Family Size |
| Alaska Natives | 100.0 /100 | #44 | Exceptional 3.37 |
| Shoshone | 100.0 /100 | #45 | Exceptional 3.37 |
| Haitians | 100.0 /100 | #46 | Exceptional 3.37 |
| Vietnamese | 100.0 /100 | #47 | Exceptional 3.37 |
| Immigrants | Nicaragua | 100.0 /100 | #48 | Exceptional 3.37 |
| Bangladeshis | 100.0 /100 | #49 | Exceptional 3.37 |
| Immigrants | Bangladesh | 100.0 /100 | #50 | Exceptional 3.36 |
| Nicaraguans | 100.0 /100 | #51 | Exceptional 3.36 |
| Fijians | 100.0 /100 | #52 | Exceptional 3.36 |
| Koreans | 100.0 /100 | #53 | Exceptional 3.36 |
| Immigrants | South Eastern Asia | 100.0 /100 | #54 | Exceptional 3.36 |
| Immigrants | Honduras | 100.0 /100 | #55 | Exceptional 3.36 |
| Immigrants | Dominican Republic | 100.0 /100 | #56 | Exceptional 3.35 |
| Sri Lankans | 100.0 /100 | #57 | Exceptional 3.35 |
| Hondurans | 100.0 /100 | #58 | Exceptional 3.35 |
| Japanese | 100.0 /100 | #59 | Exceptional 3.35 |
| Immigrants | Armenia | 100.0 /100 | #60 | Exceptional 3.35 |
| Central American Indians | 100.0 /100 | #61 | Exceptional 3.35 |
| Immigrants | Grenada | 100.0 /100 | #62 | Exceptional 3.34 |
| Chinese | 100.0 /100 | #63 | Exceptional 3.34 |
| Dominicans | 99.9 /100 | #64 | Exceptional 3.34 |