Immigrants from Grenada vs Danish Average Family Size
COMPARE
Immigrants from Grenada
Danish
Average Family Size
Average Family Size Comparison
Immigrants from Grenada
Danes
3.34
AVERAGE FAMILY SIZE
100.0/ 100
METRIC RATING
62nd/ 347
METRIC RANK
3.17
AVERAGE FAMILY SIZE
2.5/ 100
METRIC RATING
246th/ 347
METRIC RANK
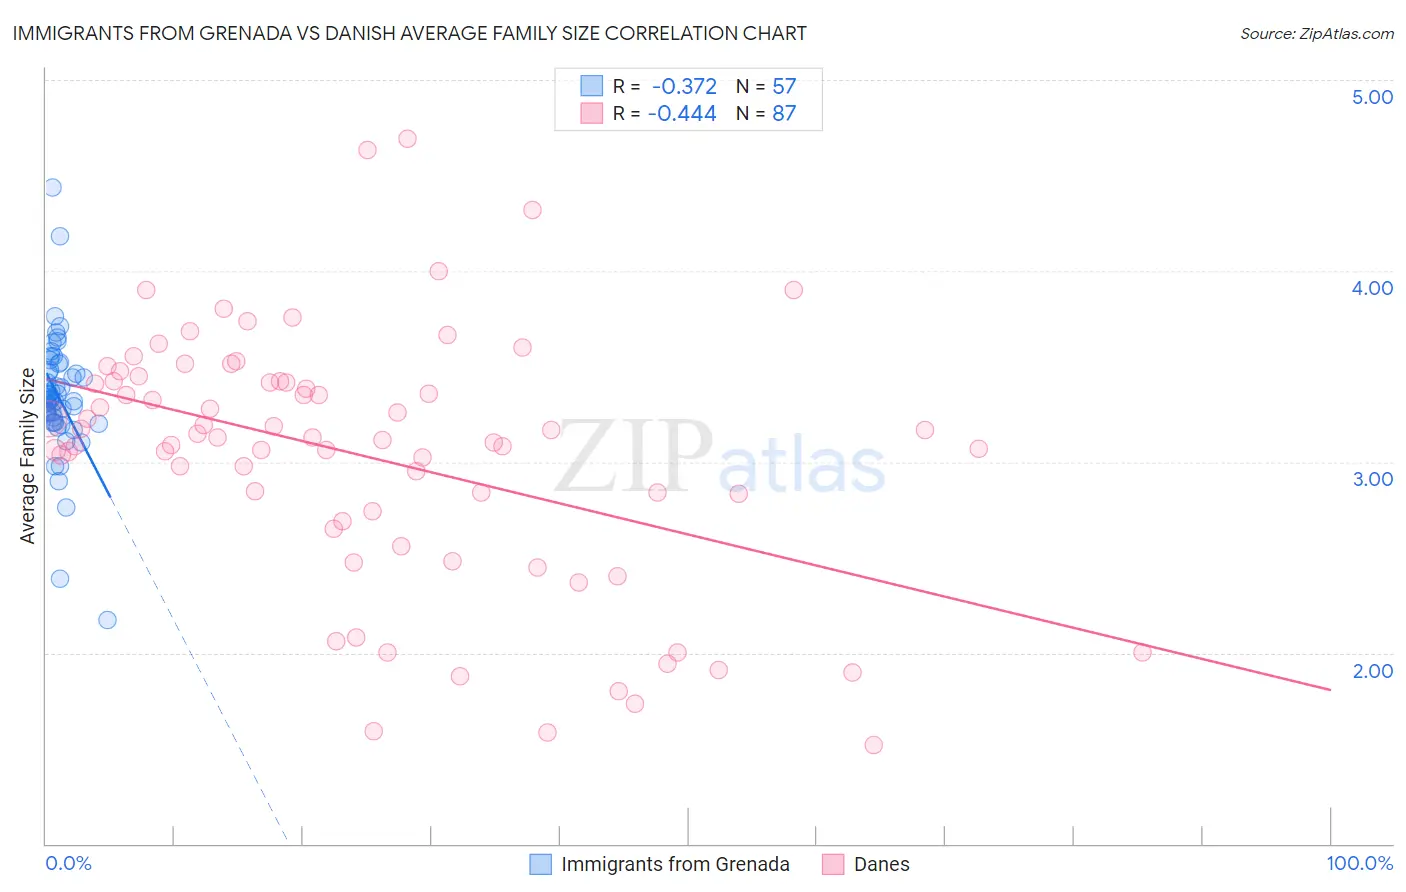
Immigrants from Grenada vs Danish Average Family Size Correlation Chart
The statistical analysis conducted on geographies consisting of 67,189,874 people shows a mild negative correlation between the proportion of Immigrants from Grenada and average family size in the United States with a correlation coefficient (R) of -0.372 and weighted average of 3.34. Similarly, the statistical analysis conducted on geographies consisting of 473,910,461 people shows a moderate negative correlation between the proportion of Danes and average family size in the United States with a correlation coefficient (R) of -0.444 and weighted average of 3.17, a difference of 5.2%.
Average Family Size Correlation Summary
| Measurement | Immigrants from Grenada | Danish |
| Minimum | 2.17 | 1.52 |
| Maximum | 4.44 | 4.69 |
| Range | 2.27 | 3.17 |
| Mean | 3.34 | 3.03 |
| Median | 3.33 | 3.12 |
| Interquartile 25% (IQ1) | 3.21 | 2.69 |
| Interquartile 75% (IQ3) | 3.50 | 3.42 |
| Interquartile Range (IQR) | 0.29 | 0.73 |
| Standard Deviation (Sample) | 0.34 | 0.67 |
| Standard Deviation (Population) | 0.33 | 0.66 |
Similar Demographics by Average Family Size
Demographics Similar to Immigrants from Grenada by Average Family Size
In terms of average family size, the demographic groups most similar to Immigrants from Grenada are Chinese (3.34, a difference of 0.020%), Dominican (3.34, a difference of 0.090%), Immigrants from Laos (3.34, a difference of 0.11%), Immigrants from St. Vincent and the Grenadines (3.34, a difference of 0.17%), and Central American Indian (3.35, a difference of 0.19%).
| Demographics | Rating | Rank | Average Family Size |
| Immigrants | Honduras | 100.0 /100 | #55 | Exceptional 3.36 |
| Immigrants | Dominican Republic | 100.0 /100 | #56 | Exceptional 3.35 |
| Sri Lankans | 100.0 /100 | #57 | Exceptional 3.35 |
| Hondurans | 100.0 /100 | #58 | Exceptional 3.35 |
| Japanese | 100.0 /100 | #59 | Exceptional 3.35 |
| Immigrants | Armenia | 100.0 /100 | #60 | Exceptional 3.35 |
| Central American Indians | 100.0 /100 | #61 | Exceptional 3.35 |
| Immigrants | Grenada | 100.0 /100 | #62 | Exceptional 3.34 |
| Chinese | 100.0 /100 | #63 | Exceptional 3.34 |
| Dominicans | 99.9 /100 | #64 | Exceptional 3.34 |
| Immigrants | Laos | 99.9 /100 | #65 | Exceptional 3.34 |
| Immigrants | St. Vincent and the Grenadines | 99.9 /100 | #66 | Exceptional 3.34 |
| Immigrants | Jamaica | 99.9 /100 | #67 | Exceptional 3.33 |
| Immigrants | Cambodia | 99.9 /100 | #68 | Exceptional 3.33 |
| Immigrants | Immigrants | 99.9 /100 | #69 | Exceptional 3.33 |
Demographics Similar to Danes by Average Family Size
In terms of average family size, the demographic groups most similar to Danes are Cajun (3.17, a difference of 0.010%), Immigrants from Brazil (3.18, a difference of 0.040%), Immigrants from Belarus (3.17, a difference of 0.040%), Immigrants from Southern Europe (3.18, a difference of 0.070%), and Hungarian (3.18, a difference of 0.080%).
| Demographics | Rating | Rank | Average Family Size |
| Houma | 3.4 /100 | #239 | Tragic 3.18 |
| Osage | 3.2 /100 | #240 | Tragic 3.18 |
| Immigrants | Japan | 3.0 /100 | #241 | Tragic 3.18 |
| Hungarians | 3.0 /100 | #242 | Tragic 3.18 |
| Immigrants | Moldova | 2.9 /100 | #243 | Tragic 3.18 |
| Immigrants | Southern Europe | 2.9 /100 | #244 | Tragic 3.18 |
| Immigrants | Brazil | 2.7 /100 | #245 | Tragic 3.18 |
| Danes | 2.5 /100 | #246 | Tragic 3.17 |
| Cajuns | 2.4 /100 | #247 | Tragic 3.17 |
| Immigrants | Belarus | 2.3 /100 | #248 | Tragic 3.17 |
| Immigrants | Eastern Europe | 2.1 /100 | #249 | Tragic 3.17 |
| Puget Sound Salish | 1.9 /100 | #250 | Tragic 3.17 |
| Immigrants | Spain | 1.8 /100 | #251 | Tragic 3.17 |
| Immigrants | Saudi Arabia | 1.7 /100 | #252 | Tragic 3.17 |
| South Africans | 1.7 /100 | #253 | Tragic 3.17 |