Immigrants from Grenada vs Houma Average Family Size
COMPARE
Immigrants from Grenada
Houma
Average Family Size
Average Family Size Comparison
Immigrants from Grenada
Houma
3.34
AVERAGE FAMILY SIZE
100.0/ 100
METRIC RATING
62nd/ 347
METRIC RANK
3.18
AVERAGE FAMILY SIZE
3.4/ 100
METRIC RATING
239th/ 347
METRIC RANK
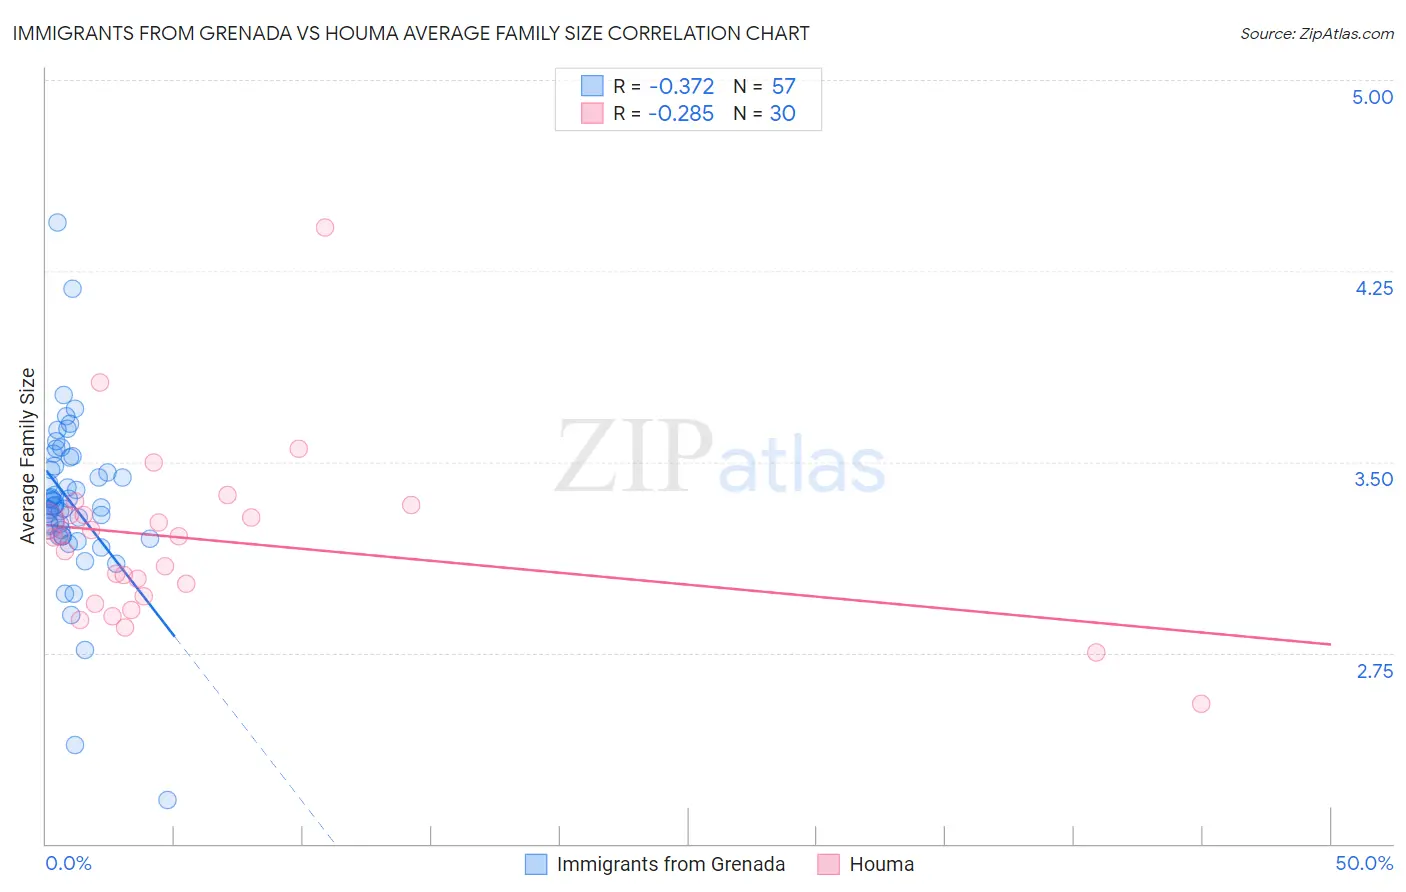
Immigrants from Grenada vs Houma Average Family Size Correlation Chart
The statistical analysis conducted on geographies consisting of 67,189,874 people shows a mild negative correlation between the proportion of Immigrants from Grenada and average family size in the United States with a correlation coefficient (R) of -0.372 and weighted average of 3.34. Similarly, the statistical analysis conducted on geographies consisting of 36,793,313 people shows a weak negative correlation between the proportion of Houma and average family size in the United States with a correlation coefficient (R) of -0.285 and weighted average of 3.18, a difference of 5.1%.
Average Family Size Correlation Summary
| Measurement | Immigrants from Grenada | Houma |
| Minimum | 2.17 | 2.55 |
| Maximum | 4.44 | 4.42 |
| Range | 2.27 | 1.87 |
| Mean | 3.34 | 3.19 |
| Median | 3.33 | 3.20 |
| Interquartile 25% (IQ1) | 3.21 | 2.97 |
| Interquartile 75% (IQ3) | 3.50 | 3.29 |
| Interquartile Range (IQR) | 0.29 | 0.32 |
| Standard Deviation (Sample) | 0.34 | 0.34 |
| Standard Deviation (Population) | 0.33 | 0.34 |
Similar Demographics by Average Family Size
Demographics Similar to Immigrants from Grenada by Average Family Size
In terms of average family size, the demographic groups most similar to Immigrants from Grenada are Chinese (3.34, a difference of 0.020%), Dominican (3.34, a difference of 0.090%), Immigrants from Laos (3.34, a difference of 0.11%), Immigrants from St. Vincent and the Grenadines (3.34, a difference of 0.17%), and Central American Indian (3.35, a difference of 0.19%).
| Demographics | Rating | Rank | Average Family Size |
| Immigrants | Honduras | 100.0 /100 | #55 | Exceptional 3.36 |
| Immigrants | Dominican Republic | 100.0 /100 | #56 | Exceptional 3.35 |
| Sri Lankans | 100.0 /100 | #57 | Exceptional 3.35 |
| Hondurans | 100.0 /100 | #58 | Exceptional 3.35 |
| Japanese | 100.0 /100 | #59 | Exceptional 3.35 |
| Immigrants | Armenia | 100.0 /100 | #60 | Exceptional 3.35 |
| Central American Indians | 100.0 /100 | #61 | Exceptional 3.35 |
| Immigrants | Grenada | 100.0 /100 | #62 | Exceptional 3.34 |
| Chinese | 100.0 /100 | #63 | Exceptional 3.34 |
| Dominicans | 99.9 /100 | #64 | Exceptional 3.34 |
| Immigrants | Laos | 99.9 /100 | #65 | Exceptional 3.34 |
| Immigrants | St. Vincent and the Grenadines | 99.9 /100 | #66 | Exceptional 3.34 |
| Immigrants | Jamaica | 99.9 /100 | #67 | Exceptional 3.33 |
| Immigrants | Cambodia | 99.9 /100 | #68 | Exceptional 3.33 |
| Immigrants | Immigrants | 99.9 /100 | #69 | Exceptional 3.33 |
Demographics Similar to Houma by Average Family Size
In terms of average family size, the demographic groups most similar to Houma are Osage (3.18, a difference of 0.020%), Immigrants from Romania (3.18, a difference of 0.050%), Romanian (3.18, a difference of 0.050%), Immigrants from Japan (3.18, a difference of 0.050%), and Hungarian (3.18, a difference of 0.060%).
| Demographics | Rating | Rank | Average Family Size |
| Cherokee | 4.7 /100 | #232 | Tragic 3.18 |
| Brazilians | 4.5 /100 | #233 | Tragic 3.18 |
| Iranians | 4.5 /100 | #234 | Tragic 3.18 |
| Immigrants | Turkey | 4.2 /100 | #235 | Tragic 3.18 |
| Immigrants | Portugal | 4.2 /100 | #236 | Tragic 3.18 |
| Immigrants | Romania | 3.7 /100 | #237 | Tragic 3.18 |
| Romanians | 3.7 /100 | #238 | Tragic 3.18 |
| Houma | 3.4 /100 | #239 | Tragic 3.18 |
| Osage | 3.2 /100 | #240 | Tragic 3.18 |
| Immigrants | Japan | 3.0 /100 | #241 | Tragic 3.18 |
| Hungarians | 3.0 /100 | #242 | Tragic 3.18 |
| Immigrants | Moldova | 2.9 /100 | #243 | Tragic 3.18 |
| Immigrants | Southern Europe | 2.9 /100 | #244 | Tragic 3.18 |
| Immigrants | Brazil | 2.7 /100 | #245 | Tragic 3.18 |
| Danes | 2.5 /100 | #246 | Tragic 3.17 |