Immigrants from North Macedonia vs German Russian Average Family Size
COMPARE
Immigrants from North Macedonia
German Russian
Average Family Size
Average Family Size Comparison
Immigrants from North Macedonia
German Russians
3.16
AVERAGE FAMILY SIZE
1.3/ 100
METRIC RATING
261st/ 347
METRIC RANK
3.15
AVERAGE FAMILY SIZE
0.4/ 100
METRIC RATING
283rd/ 347
METRIC RANK
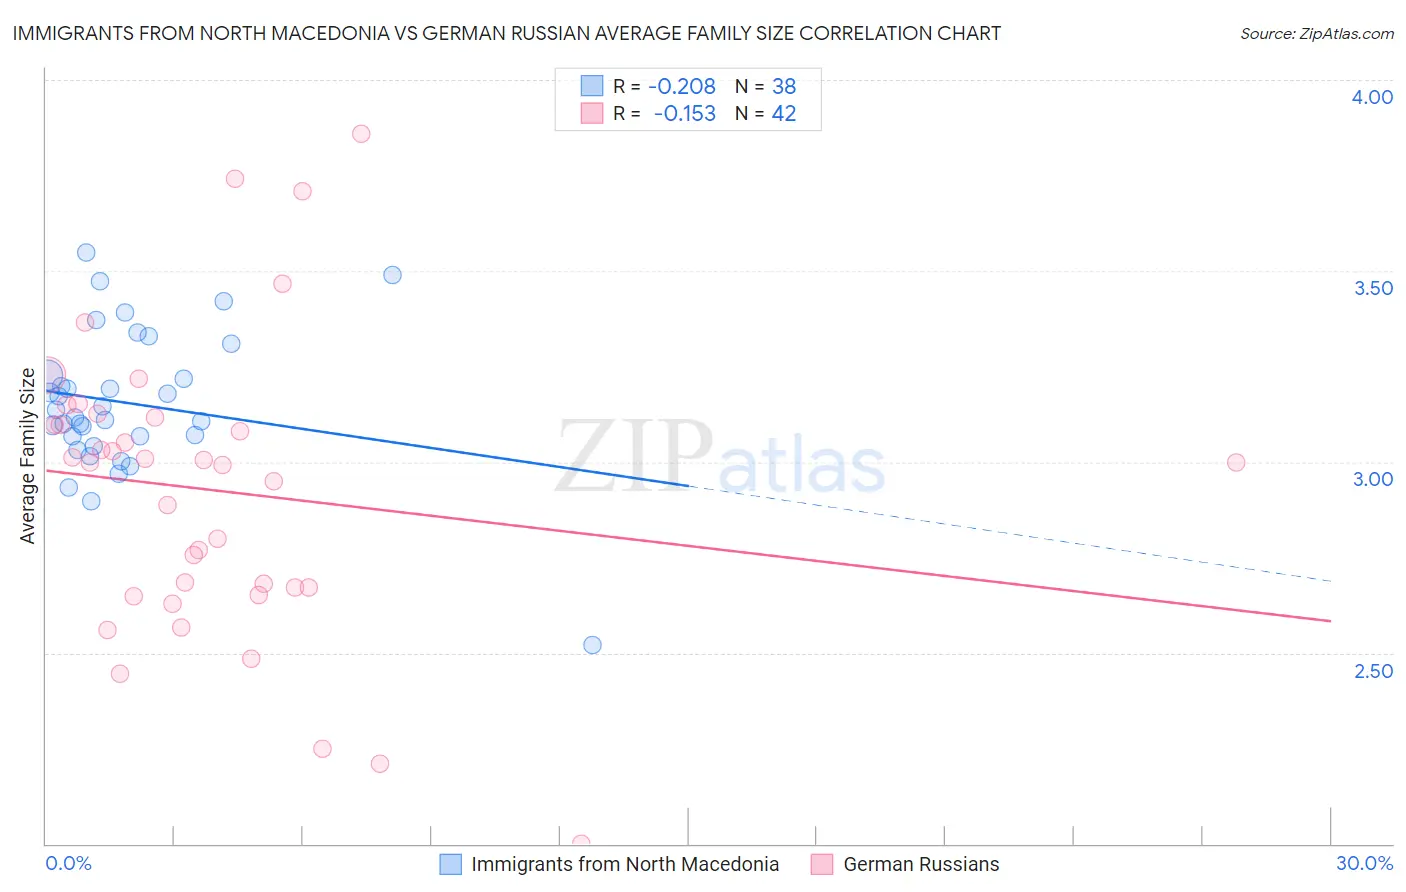
Immigrants from North Macedonia vs German Russian Average Family Size Correlation Chart
The statistical analysis conducted on geographies consisting of 74,306,697 people shows a weak negative correlation between the proportion of Immigrants from North Macedonia and average family size in the United States with a correlation coefficient (R) of -0.208 and weighted average of 3.16. Similarly, the statistical analysis conducted on geographies consisting of 96,451,127 people shows a poor negative correlation between the proportion of German Russians and average family size in the United States with a correlation coefficient (R) of -0.153 and weighted average of 3.15, a difference of 0.57%.
Average Family Size Correlation Summary
| Measurement | Immigrants from North Macedonia | German Russian |
| Minimum | 2.52 | 2.00 |
| Maximum | 3.55 | 3.86 |
| Range | 1.03 | 1.86 |
| Mean | 3.15 | 2.92 |
| Median | 3.13 | 3.00 |
| Interquartile 25% (IQ1) | 3.07 | 2.67 |
| Interquartile 75% (IQ3) | 3.23 | 3.11 |
| Interquartile Range (IQR) | 0.16 | 0.44 |
| Standard Deviation (Sample) | 0.19 | 0.39 |
| Standard Deviation (Population) | 0.19 | 0.38 |
Similar Demographics by Average Family Size
Demographics Similar to Immigrants from North Macedonia by Average Family Size
In terms of average family size, the demographic groups most similar to Immigrants from North Macedonia are Turkish (3.16, a difference of 0.010%), Potawatomi (3.16, a difference of 0.010%), Immigrants from Albania (3.16, a difference of 0.010%), Immigrants from Russia (3.16, a difference of 0.010%), and Albanian (3.17, a difference of 0.060%).
| Demographics | Rating | Rank | Average Family Size |
| Immigrants | Hungary | 1.7 /100 | #254 | Tragic 3.17 |
| Cape Verdeans | 1.6 /100 | #255 | Tragic 3.17 |
| Immigrants | Kazakhstan | 1.5 /100 | #256 | Tragic 3.17 |
| Albanians | 1.5 /100 | #257 | Tragic 3.17 |
| Turks | 1.3 /100 | #258 | Tragic 3.16 |
| Potawatomi | 1.3 /100 | #259 | Tragic 3.16 |
| Immigrants | Albania | 1.3 /100 | #260 | Tragic 3.16 |
| Immigrants | North Macedonia | 1.3 /100 | #261 | Tragic 3.16 |
| Immigrants | Russia | 1.3 /100 | #262 | Tragic 3.16 |
| Immigrants | Bulgaria | 1.0 /100 | #263 | Tragic 3.16 |
| Americans | 1.0 /100 | #264 | Tragic 3.16 |
| Immigrants | South Africa | 0.9 /100 | #265 | Tragic 3.16 |
| Immigrants | Greece | 0.9 /100 | #266 | Tragic 3.16 |
| Iroquois | 0.8 /100 | #267 | Tragic 3.16 |
| Maltese | 0.8 /100 | #268 | Tragic 3.16 |
Demographics Similar to German Russians by Average Family Size
In terms of average family size, the demographic groups most similar to German Russians are Yugoslavian (3.15, a difference of 0.010%), Immigrants from Denmark (3.15, a difference of 0.020%), Immigrants from France (3.15, a difference of 0.020%), Immigrants from England (3.15, a difference of 0.060%), and White/Caucasian (3.14, a difference of 0.070%).
| Demographics | Rating | Rank | Average Family Size |
| Immigrants | Bosnia and Herzegovina | 0.5 /100 | #276 | Tragic 3.15 |
| Swiss | 0.5 /100 | #277 | Tragic 3.15 |
| Okinawans | 0.5 /100 | #278 | Tragic 3.15 |
| Immigrants | Europe | 0.5 /100 | #279 | Tragic 3.15 |
| Immigrants | England | 0.4 /100 | #280 | Tragic 3.15 |
| Immigrants | Denmark | 0.4 /100 | #281 | Tragic 3.15 |
| Yugoslavians | 0.4 /100 | #282 | Tragic 3.15 |
| German Russians | 0.4 /100 | #283 | Tragic 3.15 |
| Immigrants | France | 0.4 /100 | #284 | Tragic 3.15 |
| Whites/Caucasians | 0.3 /100 | #285 | Tragic 3.14 |
| Immigrants | Netherlands | 0.3 /100 | #286 | Tragic 3.14 |
| Greeks | 0.3 /100 | #287 | Tragic 3.14 |
| Immigrants | Czechoslovakia | 0.3 /100 | #288 | Tragic 3.14 |
| Immigrants | Norway | 0.3 /100 | #289 | Tragic 3.14 |
| Cypriots | 0.3 /100 | #290 | Tragic 3.14 |