Apache vs German Russian Average Family Size
COMPARE
Apache
German Russian
Average Family Size
Average Family Size Comparison
Apache
German Russians
3.46
AVERAGE FAMILY SIZE
100.0/ 100
METRIC RATING
22nd/ 347
METRIC RANK
3.15
AVERAGE FAMILY SIZE
0.4/ 100
METRIC RATING
283rd/ 347
METRIC RANK
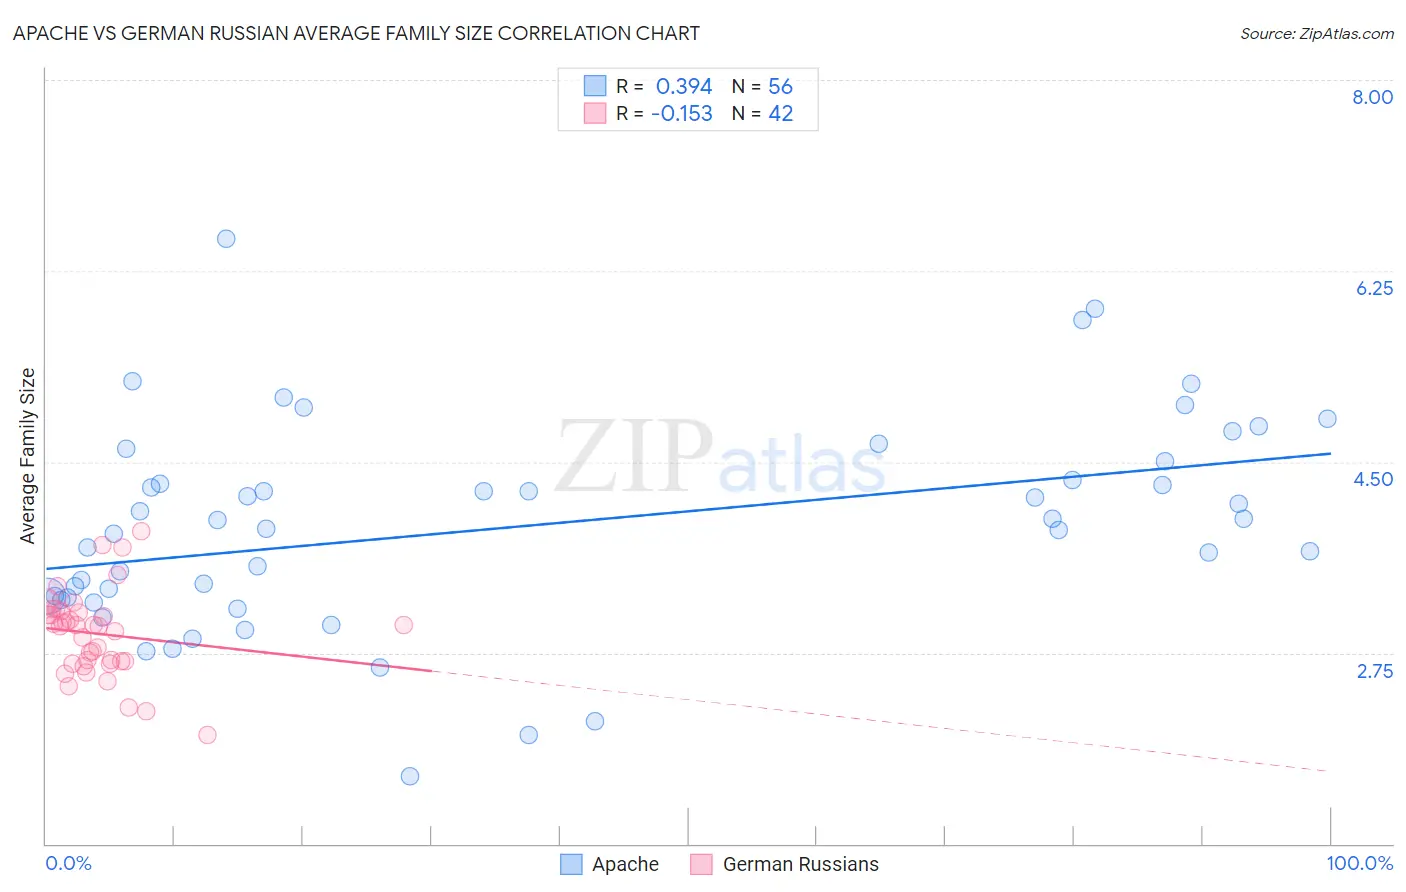
Apache vs German Russian Average Family Size Correlation Chart
The statistical analysis conducted on geographies consisting of 231,040,944 people shows a mild positive correlation between the proportion of Apache and average family size in the United States with a correlation coefficient (R) of 0.394 and weighted average of 3.46. Similarly, the statistical analysis conducted on geographies consisting of 96,451,127 people shows a poor negative correlation between the proportion of German Russians and average family size in the United States with a correlation coefficient (R) of -0.153 and weighted average of 3.15, a difference of 10.1%.
Average Family Size Correlation Summary
| Measurement | Apache | German Russian |
| Minimum | 1.62 | 2.00 |
| Maximum | 6.54 | 3.86 |
| Range | 4.92 | 1.86 |
| Mean | 3.91 | 2.92 |
| Median | 3.93 | 3.00 |
| Interquartile 25% (IQ1) | 3.27 | 2.67 |
| Interquartile 75% (IQ3) | 4.42 | 3.11 |
| Interquartile Range (IQR) | 1.15 | 0.44 |
| Standard Deviation (Sample) | 0.96 | 0.39 |
| Standard Deviation (Population) | 0.96 | 0.38 |
Similar Demographics by Average Family Size
Demographics Similar to Apache by Average Family Size
In terms of average family size, the demographic groups most similar to Apache are Yuman (3.47, a difference of 0.060%), Immigrants from Fiji (3.45, a difference of 0.29%), Cheyenne (3.47, a difference of 0.31%), Mexican (3.48, a difference of 0.35%), and Native/Alaskan (3.45, a difference of 0.41%).
| Demographics | Rating | Rank | Average Family Size |
| Tongans | 100.0 /100 | #15 | Exceptional 3.49 |
| Ute | 100.0 /100 | #16 | Exceptional 3.49 |
| Immigrants | El Salvador | 100.0 /100 | #17 | Exceptional 3.49 |
| Salvadorans | 100.0 /100 | #18 | Exceptional 3.48 |
| Mexicans | 100.0 /100 | #19 | Exceptional 3.48 |
| Cheyenne | 100.0 /100 | #20 | Exceptional 3.47 |
| Yuman | 100.0 /100 | #21 | Exceptional 3.47 |
| Apache | 100.0 /100 | #22 | Exceptional 3.46 |
| Immigrants | Fiji | 100.0 /100 | #23 | Exceptional 3.45 |
| Natives/Alaskans | 100.0 /100 | #24 | Exceptional 3.45 |
| Yakama | 100.0 /100 | #25 | Exceptional 3.45 |
| Native Hawaiians | 100.0 /100 | #26 | Exceptional 3.43 |
| Mexican American Indians | 100.0 /100 | #27 | Exceptional 3.43 |
| Immigrants | Latin America | 100.0 /100 | #28 | Exceptional 3.42 |
| Nepalese | 100.0 /100 | #29 | Exceptional 3.42 |
Demographics Similar to German Russians by Average Family Size
In terms of average family size, the demographic groups most similar to German Russians are Yugoslavian (3.15, a difference of 0.010%), Immigrants from Denmark (3.15, a difference of 0.020%), Immigrants from France (3.15, a difference of 0.020%), Immigrants from England (3.15, a difference of 0.060%), and White/Caucasian (3.14, a difference of 0.070%).
| Demographics | Rating | Rank | Average Family Size |
| Immigrants | Bosnia and Herzegovina | 0.5 /100 | #276 | Tragic 3.15 |
| Swiss | 0.5 /100 | #277 | Tragic 3.15 |
| Okinawans | 0.5 /100 | #278 | Tragic 3.15 |
| Immigrants | Europe | 0.5 /100 | #279 | Tragic 3.15 |
| Immigrants | England | 0.4 /100 | #280 | Tragic 3.15 |
| Immigrants | Denmark | 0.4 /100 | #281 | Tragic 3.15 |
| Yugoslavians | 0.4 /100 | #282 | Tragic 3.15 |
| German Russians | 0.4 /100 | #283 | Tragic 3.15 |
| Immigrants | France | 0.4 /100 | #284 | Tragic 3.15 |
| Whites/Caucasians | 0.3 /100 | #285 | Tragic 3.14 |
| Immigrants | Netherlands | 0.3 /100 | #286 | Tragic 3.14 |
| Greeks | 0.3 /100 | #287 | Tragic 3.14 |
| Immigrants | Czechoslovakia | 0.3 /100 | #288 | Tragic 3.14 |
| Immigrants | Norway | 0.3 /100 | #289 | Tragic 3.14 |
| Cypriots | 0.3 /100 | #290 | Tragic 3.14 |