Swedish vs German Russian Average Family Size
COMPARE
Swedish
German Russian
Average Family Size
Average Family Size Comparison
Swedes
German Russians
3.10
AVERAGE FAMILY SIZE
0.0/ 100
METRIC RATING
337th/ 347
METRIC RANK
3.15
AVERAGE FAMILY SIZE
0.4/ 100
METRIC RATING
283rd/ 347
METRIC RANK
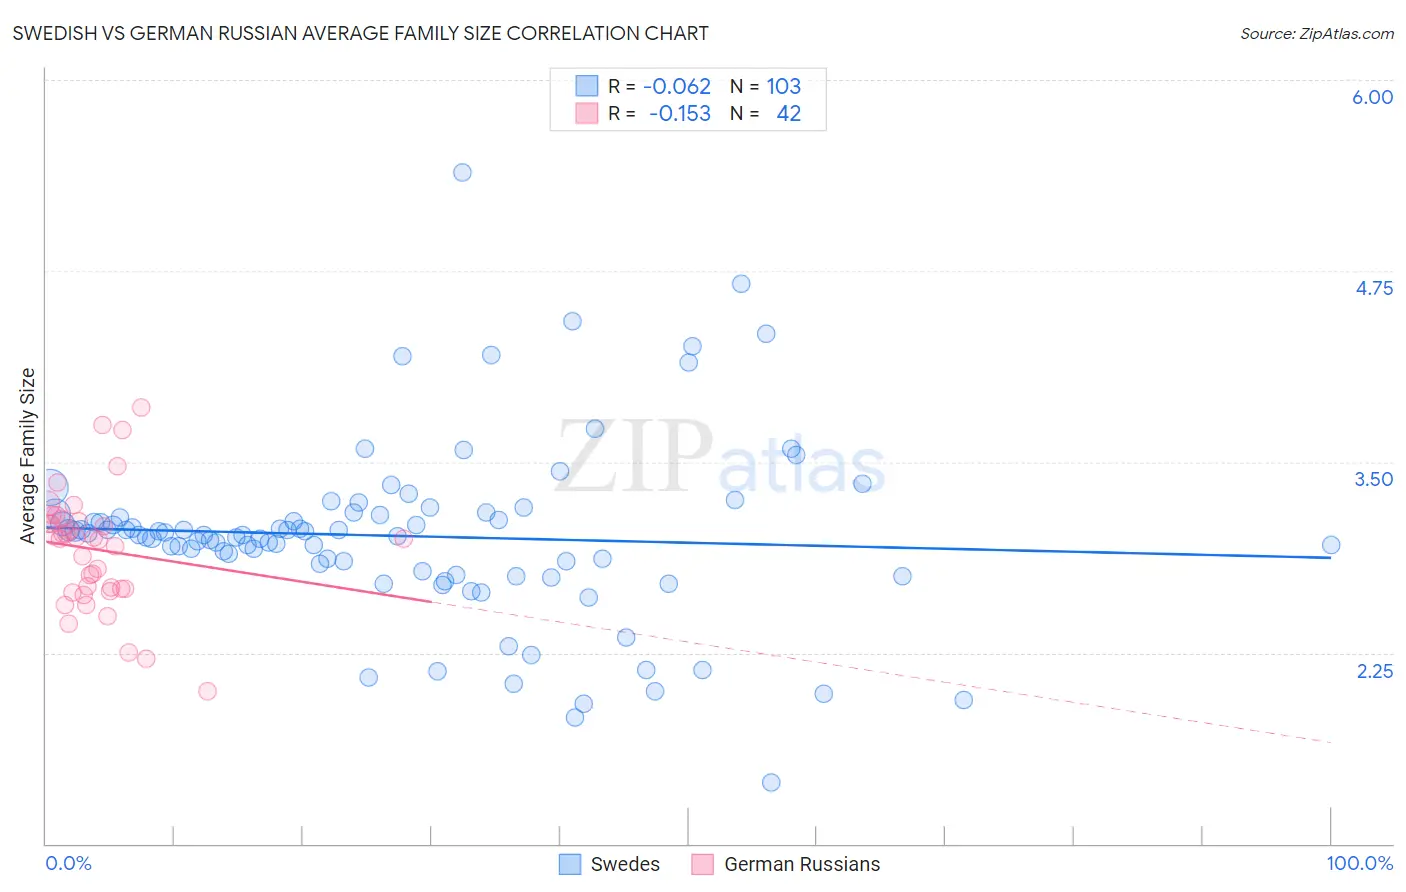
Swedish vs German Russian Average Family Size Correlation Chart
The statistical analysis conducted on geographies consisting of 538,762,324 people shows a slight negative correlation between the proportion of Swedes and average family size in the United States with a correlation coefficient (R) of -0.062 and weighted average of 3.10. Similarly, the statistical analysis conducted on geographies consisting of 96,451,127 people shows a poor negative correlation between the proportion of German Russians and average family size in the United States with a correlation coefficient (R) of -0.153 and weighted average of 3.15, a difference of 1.5%.
Average Family Size Correlation Summary
| Measurement | Swedish | German Russian |
| Minimum | 1.40 | 2.00 |
| Maximum | 5.39 | 3.86 |
| Range | 3.99 | 1.86 |
| Mean | 3.01 | 2.92 |
| Median | 3.02 | 3.00 |
| Interquartile 25% (IQ1) | 2.79 | 2.67 |
| Interquartile 75% (IQ3) | 3.16 | 3.11 |
| Interquartile Range (IQR) | 0.37 | 0.44 |
| Standard Deviation (Sample) | 0.59 | 0.39 |
| Standard Deviation (Population) | 0.59 | 0.38 |
Similar Demographics by Average Family Size
Demographics Similar to Swedes by Average Family Size
In terms of average family size, the demographic groups most similar to Swedes are French (3.10, a difference of 0.020%), Irish (3.10, a difference of 0.030%), Croatian (3.10, a difference of 0.030%), Luxembourger (3.10, a difference of 0.090%), and Lithuanian (3.10, a difference of 0.12%).
| Demographics | Rating | Rank | Average Family Size |
| Latvians | 0.0 /100 | #330 | Tragic 3.11 |
| Scotch-Irish | 0.0 /100 | #331 | Tragic 3.11 |
| Scottish | 0.0 /100 | #332 | Tragic 3.11 |
| Estonians | 0.0 /100 | #333 | Tragic 3.10 |
| Lithuanians | 0.0 /100 | #334 | Tragic 3.10 |
| Luxembourgers | 0.0 /100 | #335 | Tragic 3.10 |
| Irish | 0.0 /100 | #336 | Tragic 3.10 |
| Swedes | 0.0 /100 | #337 | Tragic 3.10 |
| French | 0.0 /100 | #338 | Tragic 3.10 |
| Croatians | 0.0 /100 | #339 | Tragic 3.10 |
| Finns | 0.0 /100 | #340 | Tragic 3.09 |
| Poles | 0.0 /100 | #341 | Tragic 3.09 |
| Germans | 0.0 /100 | #342 | Tragic 3.09 |
| Norwegians | 0.0 /100 | #343 | Tragic 3.08 |
| French Canadians | 0.0 /100 | #344 | Tragic 3.07 |
Demographics Similar to German Russians by Average Family Size
In terms of average family size, the demographic groups most similar to German Russians are Yugoslavian (3.15, a difference of 0.010%), Immigrants from Denmark (3.15, a difference of 0.020%), Immigrants from France (3.15, a difference of 0.020%), Immigrants from England (3.15, a difference of 0.060%), and White/Caucasian (3.14, a difference of 0.070%).
| Demographics | Rating | Rank | Average Family Size |
| Immigrants | Bosnia and Herzegovina | 0.5 /100 | #276 | Tragic 3.15 |
| Swiss | 0.5 /100 | #277 | Tragic 3.15 |
| Okinawans | 0.5 /100 | #278 | Tragic 3.15 |
| Immigrants | Europe | 0.5 /100 | #279 | Tragic 3.15 |
| Immigrants | England | 0.4 /100 | #280 | Tragic 3.15 |
| Immigrants | Denmark | 0.4 /100 | #281 | Tragic 3.15 |
| Yugoslavians | 0.4 /100 | #282 | Tragic 3.15 |
| German Russians | 0.4 /100 | #283 | Tragic 3.15 |
| Immigrants | France | 0.4 /100 | #284 | Tragic 3.15 |
| Whites/Caucasians | 0.3 /100 | #285 | Tragic 3.14 |
| Immigrants | Netherlands | 0.3 /100 | #286 | Tragic 3.14 |
| Greeks | 0.3 /100 | #287 | Tragic 3.14 |
| Immigrants | Czechoslovakia | 0.3 /100 | #288 | Tragic 3.14 |
| Immigrants | Norway | 0.3 /100 | #289 | Tragic 3.14 |
| Cypriots | 0.3 /100 | #290 | Tragic 3.14 |