Immigrants from France vs Immigrants from South Eastern Asia Currently Married
COMPARE
Immigrants from France
Immigrants from South Eastern Asia
Currently Married
Currently Married Comparison
Immigrants from France
Immigrants from South Eastern Asia
46.2%
CURRENTLY MARRIED
27.7/ 100
METRIC RATING
191st/ 347
METRIC RANK
47.1%
CURRENTLY MARRIED
72.9/ 100
METRIC RATING
145th/ 347
METRIC RANK
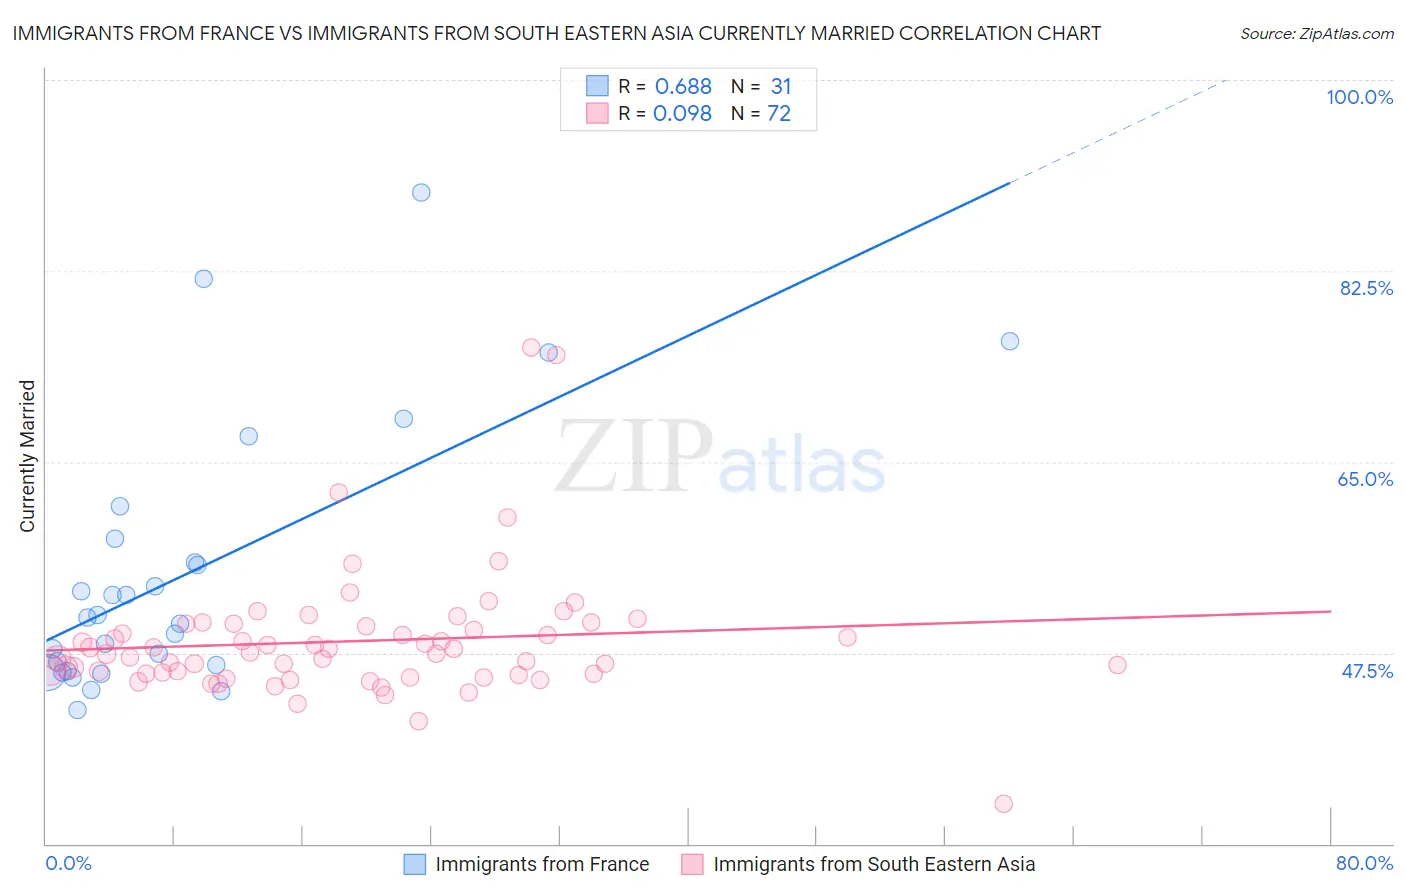
Immigrants from France vs Immigrants from South Eastern Asia Currently Married Correlation Chart
The statistical analysis conducted on geographies consisting of 287,900,584 people shows a significant positive correlation between the proportion of Immigrants from France and percentage of population currently married in the United States with a correlation coefficient (R) of 0.688 and weighted average of 46.2%. Similarly, the statistical analysis conducted on geographies consisting of 512,635,573 people shows a slight positive correlation between the proportion of Immigrants from South Eastern Asia and percentage of population currently married in the United States with a correlation coefficient (R) of 0.098 and weighted average of 47.1%, a difference of 1.8%.
Currently Married Correlation Summary
| Measurement | Immigrants from France | Immigrants from South Eastern Asia |
| Minimum | 42.2% | 33.6% |
| Maximum | 89.7% | 75.5% |
| Range | 47.5% | 41.9% |
| Mean | 54.8% | 48.6% |
| Median | 50.8% | 47.5% |
| Interquartile 25% (IQ1) | 45.8% | 45.6% |
| Interquartile 75% (IQ3) | 57.9% | 50.1% |
| Interquartile Range (IQR) | 12.1% | 4.5% |
| Standard Deviation (Sample) | 12.1% | 6.0% |
| Standard Deviation (Population) | 11.9% | 5.9% |
Similar Demographics by Currently Married
Demographics Similar to Immigrants from France by Currently Married
In terms of currently married, the demographic groups most similar to Immigrants from France are Choctaw (46.3%, a difference of 0.060%), Soviet Union (46.2%, a difference of 0.090%), Fijian (46.3%, a difference of 0.12%), Immigrants from Fiji (46.2%, a difference of 0.13%), and Colombian (46.3%, a difference of 0.18%).
| Demographics | Rating | Rank | Currently Married |
| Brazilians | 39.3 /100 | #184 | Fair 46.4% |
| Mongolians | 37.6 /100 | #185 | Fair 46.4% |
| Immigrants | Chile | 36.8 /100 | #186 | Fair 46.4% |
| Immigrants | Peru | 35.3 /100 | #187 | Fair 46.4% |
| Colombians | 31.8 /100 | #188 | Fair 46.3% |
| Fijians | 30.3 /100 | #189 | Fair 46.3% |
| Choctaw | 29.1 /100 | #190 | Fair 46.3% |
| Immigrants | France | 27.7 /100 | #191 | Fair 46.2% |
| Soviet Union | 25.7 /100 | #192 | Fair 46.2% |
| Immigrants | Fiji | 25.0 /100 | #193 | Fair 46.2% |
| South Americans | 23.8 /100 | #194 | Fair 46.1% |
| Immigrants | Nepal | 23.7 /100 | #195 | Fair 46.1% |
| Immigrants | Bosnia and Herzegovina | 22.2 /100 | #196 | Fair 46.1% |
| Immigrants | Kuwait | 21.7 /100 | #197 | Fair 46.1% |
| Immigrants | Colombia | 21.0 /100 | #198 | Fair 46.1% |
Demographics Similar to Immigrants from South Eastern Asia by Currently Married
In terms of currently married, the demographic groups most similar to Immigrants from South Eastern Asia are Carpatho Rusyn (47.0%, a difference of 0.010%), Hmong (47.1%, a difference of 0.030%), Immigrants from Argentina (47.0%, a difference of 0.040%), Guamanian/Chamorro (47.1%, a difference of 0.060%), and Venezuelan (47.1%, a difference of 0.070%).
| Demographics | Rating | Rank | Currently Married |
| Pakistanis | 77.5 /100 | #138 | Good 47.2% |
| Yugoslavians | 77.4 /100 | #139 | Good 47.2% |
| Cajuns | 75.3 /100 | #140 | Good 47.1% |
| Venezuelans | 74.4 /100 | #141 | Good 47.1% |
| Argentineans | 74.4 /100 | #142 | Good 47.1% |
| Guamanians/Chamorros | 74.2 /100 | #143 | Good 47.1% |
| Hmong | 73.4 /100 | #144 | Good 47.1% |
| Immigrants | South Eastern Asia | 72.9 /100 | #145 | Good 47.1% |
| Carpatho Rusyns | 72.6 /100 | #146 | Good 47.0% |
| Immigrants | Argentina | 72.0 /100 | #147 | Good 47.0% |
| Cambodians | 70.4 /100 | #148 | Good 47.0% |
| Zimbabweans | 70.1 /100 | #149 | Good 47.0% |
| Immigrants | Turkey | 70.0 /100 | #150 | Good 47.0% |
| Chileans | 69.8 /100 | #151 | Good 47.0% |
| Immigrants | Serbia | 68.8 /100 | #152 | Good 47.0% |