Immigrants from France vs Haitian Currently Married
COMPARE
Immigrants from France
Haitian
Currently Married
Currently Married Comparison
Immigrants from France
Haitians
46.2%
CURRENTLY MARRIED
27.7/ 100
METRIC RATING
191st/ 347
METRIC RANK
41.3%
CURRENTLY MARRIED
0.0/ 100
METRIC RATING
317th/ 347
METRIC RANK
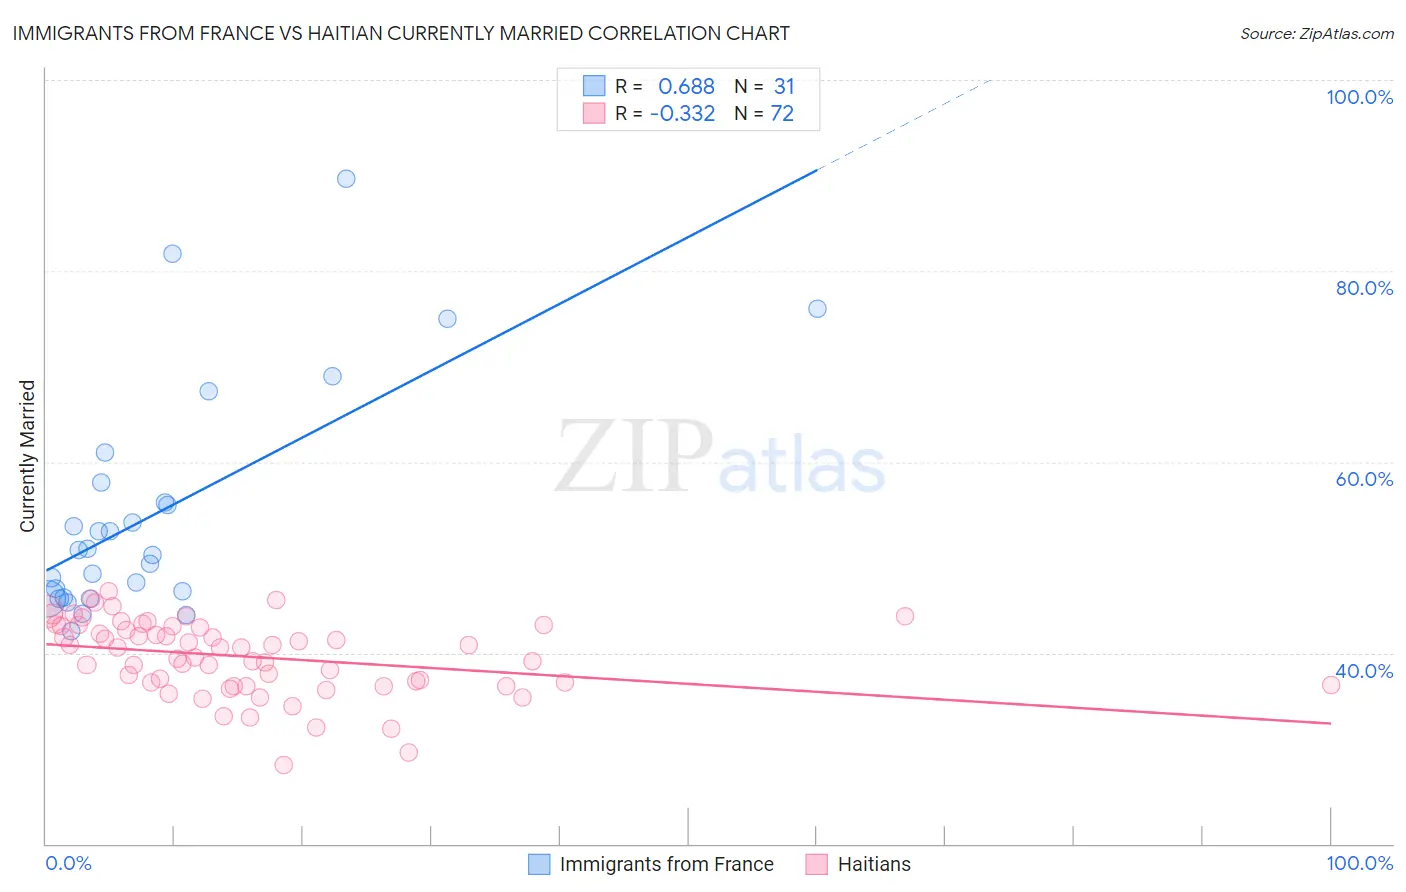
Immigrants from France vs Haitian Currently Married Correlation Chart
The statistical analysis conducted on geographies consisting of 287,900,584 people shows a significant positive correlation between the proportion of Immigrants from France and percentage of population currently married in the United States with a correlation coefficient (R) of 0.688 and weighted average of 46.2%. Similarly, the statistical analysis conducted on geographies consisting of 287,965,636 people shows a mild negative correlation between the proportion of Haitians and percentage of population currently married in the United States with a correlation coefficient (R) of -0.332 and weighted average of 41.3%, a difference of 12.0%.
Currently Married Correlation Summary
| Measurement | Immigrants from France | Haitian |
| Minimum | 42.2% | 28.3% |
| Maximum | 89.7% | 46.5% |
| Range | 47.5% | 18.2% |
| Mean | 54.8% | 39.6% |
| Median | 50.8% | 40.6% |
| Interquartile 25% (IQ1) | 45.8% | 36.7% |
| Interquartile 75% (IQ3) | 57.9% | 42.8% |
| Interquartile Range (IQR) | 12.1% | 6.1% |
| Standard Deviation (Sample) | 12.1% | 3.9% |
| Standard Deviation (Population) | 11.9% | 3.9% |
Similar Demographics by Currently Married
Demographics Similar to Immigrants from France by Currently Married
In terms of currently married, the demographic groups most similar to Immigrants from France are Choctaw (46.3%, a difference of 0.060%), Soviet Union (46.2%, a difference of 0.090%), Fijian (46.3%, a difference of 0.12%), Immigrants from Fiji (46.2%, a difference of 0.13%), and Colombian (46.3%, a difference of 0.18%).
| Demographics | Rating | Rank | Currently Married |
| Brazilians | 39.3 /100 | #184 | Fair 46.4% |
| Mongolians | 37.6 /100 | #185 | Fair 46.4% |
| Immigrants | Chile | 36.8 /100 | #186 | Fair 46.4% |
| Immigrants | Peru | 35.3 /100 | #187 | Fair 46.4% |
| Colombians | 31.8 /100 | #188 | Fair 46.3% |
| Fijians | 30.3 /100 | #189 | Fair 46.3% |
| Choctaw | 29.1 /100 | #190 | Fair 46.3% |
| Immigrants | France | 27.7 /100 | #191 | Fair 46.2% |
| Soviet Union | 25.7 /100 | #192 | Fair 46.2% |
| Immigrants | Fiji | 25.0 /100 | #193 | Fair 46.2% |
| South Americans | 23.8 /100 | #194 | Fair 46.1% |
| Immigrants | Nepal | 23.7 /100 | #195 | Fair 46.1% |
| Immigrants | Bosnia and Herzegovina | 22.2 /100 | #196 | Fair 46.1% |
| Immigrants | Kuwait | 21.7 /100 | #197 | Fair 46.1% |
| Immigrants | Colombia | 21.0 /100 | #198 | Fair 46.1% |
Demographics Similar to Haitians by Currently Married
In terms of currently married, the demographic groups most similar to Haitians are Immigrants from Caribbean (41.3%, a difference of 0.020%), Inupiat (41.3%, a difference of 0.080%), West Indian (41.3%, a difference of 0.17%), Bahamian (41.2%, a difference of 0.18%), and Immigrants from Somalia (41.2%, a difference of 0.20%).
| Demographics | Rating | Rank | Currently Married |
| Guyanese | 0.0 /100 | #310 | Tragic 41.6% |
| Trinidadians and Tobagonians | 0.0 /100 | #311 | Tragic 41.5% |
| Somalis | 0.0 /100 | #312 | Tragic 41.5% |
| Jamaicans | 0.0 /100 | #313 | Tragic 41.4% |
| West Indians | 0.0 /100 | #314 | Tragic 41.3% |
| Inupiat | 0.0 /100 | #315 | Tragic 41.3% |
| Immigrants | Caribbean | 0.0 /100 | #316 | Tragic 41.3% |
| Haitians | 0.0 /100 | #317 | Tragic 41.3% |
| Bahamians | 0.0 /100 | #318 | Tragic 41.2% |
| Immigrants | Somalia | 0.0 /100 | #319 | Tragic 41.2% |
| Immigrants | Jamaica | 0.0 /100 | #320 | Tragic 41.1% |
| Immigrants | Congo | 0.0 /100 | #321 | Tragic 41.1% |
| Immigrants | Haiti | 0.0 /100 | #322 | Tragic 41.0% |
| Immigrants | West Indies | 0.0 /100 | #323 | Tragic 40.7% |
| Immigrants | Senegal | 0.0 /100 | #324 | Tragic 40.7% |