Immigrants from El Salvador vs Immigrants from South America Births to Unmarried Women
COMPARE
Immigrants from El Salvador
Immigrants from South America
Births to Unmarried Women
Births to Unmarried Women Comparison
Immigrants from El Salvador
Immigrants from South America
36.4%
BIRTHS TO UNMARRIED WOMEN
0.2/ 100
METRIC RATING
259th/ 347
METRIC RANK
32.0%
BIRTHS TO UNMARRIED WOMEN
40.7/ 100
METRIC RATING
184th/ 347
METRIC RANK
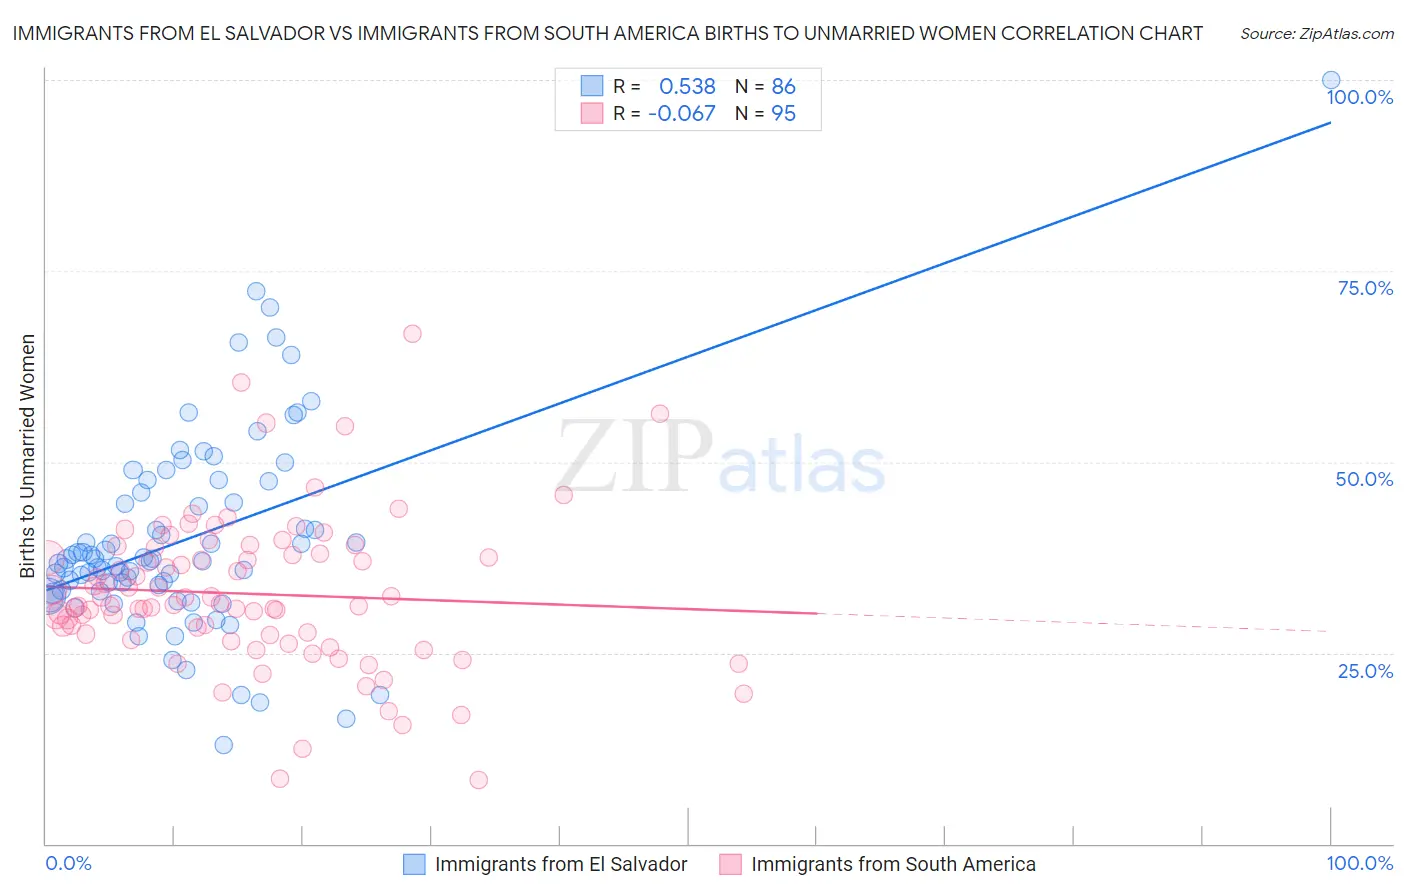
Immigrants from El Salvador vs Immigrants from South America Births to Unmarried Women Correlation Chart
The statistical analysis conducted on geographies consisting of 341,352,792 people shows a substantial positive correlation between the proportion of Immigrants from El Salvador and percentage of births to unmarried women in the United States with a correlation coefficient (R) of 0.538 and weighted average of 36.4%. Similarly, the statistical analysis conducted on geographies consisting of 446,269,177 people shows a slight negative correlation between the proportion of Immigrants from South America and percentage of births to unmarried women in the United States with a correlation coefficient (R) of -0.067 and weighted average of 32.0%, a difference of 14.0%.
Births to Unmarried Women Correlation Summary
| Measurement | Immigrants from El Salvador | Immigrants from South America |
| Minimum | 12.9% | 8.4% |
| Maximum | 100.0% | 66.7% |
| Range | 87.1% | 58.3% |
| Mean | 39.8% | 32.7% |
| Median | 37.1% | 31.3% |
| Interquartile 25% (IQ1) | 33.0% | 27.4% |
| Interquartile 75% (IQ3) | 45.9% | 38.1% |
| Interquartile Range (IQR) | 12.9% | 10.6% |
| Standard Deviation (Sample) | 13.2% | 9.9% |
| Standard Deviation (Population) | 13.2% | 9.9% |
Similar Demographics by Births to Unmarried Women
Demographics Similar to Immigrants from El Salvador by Births to Unmarried Women
In terms of births to unmarried women, the demographic groups most similar to Immigrants from El Salvador are American (36.4%, a difference of 0.050%), Ottawa (36.5%, a difference of 0.12%), Trinidadian and Tobagonian (36.5%, a difference of 0.12%), Immigrants from Grenada (36.3%, a difference of 0.33%), and Chickasaw (36.3%, a difference of 0.36%).
| Demographics | Rating | Rank | Births to Unmarried Women |
| Salvadorans | 0.3 /100 | #252 | Tragic 36.0% |
| Immigrants | Portugal | 0.2 /100 | #253 | Tragic 36.2% |
| Potawatomi | 0.2 /100 | #254 | Tragic 36.2% |
| Chickasaw | 0.2 /100 | #255 | Tragic 36.3% |
| Immigrants | Trinidad and Tobago | 0.2 /100 | #256 | Tragic 36.3% |
| Immigrants | Grenada | 0.2 /100 | #257 | Tragic 36.3% |
| Americans | 0.2 /100 | #258 | Tragic 36.4% |
| Immigrants | El Salvador | 0.2 /100 | #259 | Tragic 36.4% |
| Ottawa | 0.2 /100 | #260 | Tragic 36.5% |
| Trinidadians and Tobagonians | 0.2 /100 | #261 | Tragic 36.5% |
| French American Indians | 0.1 /100 | #262 | Tragic 36.6% |
| Nicaraguans | 0.1 /100 | #263 | Tragic 36.6% |
| Sub-Saharan Africans | 0.1 /100 | #264 | Tragic 36.7% |
| Cherokee | 0.1 /100 | #265 | Tragic 36.7% |
| Immigrants | Senegal | 0.1 /100 | #266 | Tragic 36.7% |
Demographics Similar to Immigrants from South America by Births to Unmarried Women
In terms of births to unmarried women, the demographic groups most similar to Immigrants from South America are Canadian (31.9%, a difference of 0.070%), German (32.0%, a difference of 0.11%), Kenyan (31.9%, a difference of 0.23%), Welsh (32.0%, a difference of 0.24%), and Czechoslovakian (32.0%, a difference of 0.26%).
| Demographics | Rating | Rank | Births to Unmarried Women |
| South American Indians | 47.7 /100 | #177 | Average 31.7% |
| English | 47.4 /100 | #178 | Average 31.7% |
| South Americans | 46.9 /100 | #179 | Average 31.8% |
| Moroccans | 45.7 /100 | #180 | Average 31.8% |
| Immigrants | Peru | 45.1 /100 | #181 | Average 31.8% |
| Kenyans | 43.0 /100 | #182 | Average 31.9% |
| Canadians | 41.4 /100 | #183 | Average 31.9% |
| Immigrants | South America | 40.7 /100 | #184 | Average 32.0% |
| Germans | 39.5 /100 | #185 | Fair 32.0% |
| Welsh | 38.2 /100 | #186 | Fair 32.0% |
| Czechoslovakians | 38.0 /100 | #187 | Fair 32.0% |
| Osage | 37.1 /100 | #188 | Fair 32.1% |
| Immigrants | Kenya | 36.9 /100 | #189 | Fair 32.1% |
| Tlingit-Haida | 32.6 /100 | #190 | Fair 32.2% |
| Irish | 32.4 /100 | #191 | Fair 32.2% |