Immigrants from El Salvador vs Immigrants from Belgium Births to Unmarried Women
COMPARE
Immigrants from El Salvador
Immigrants from Belgium
Births to Unmarried Women
Births to Unmarried Women Comparison
Immigrants from El Salvador
Immigrants from Belgium
36.4%
BIRTHS TO UNMARRIED WOMEN
0.2/ 100
METRIC RATING
259th/ 347
METRIC RANK
28.0%
BIRTHS TO UNMARRIED WOMEN
99.3/ 100
METRIC RATING
56th/ 347
METRIC RANK
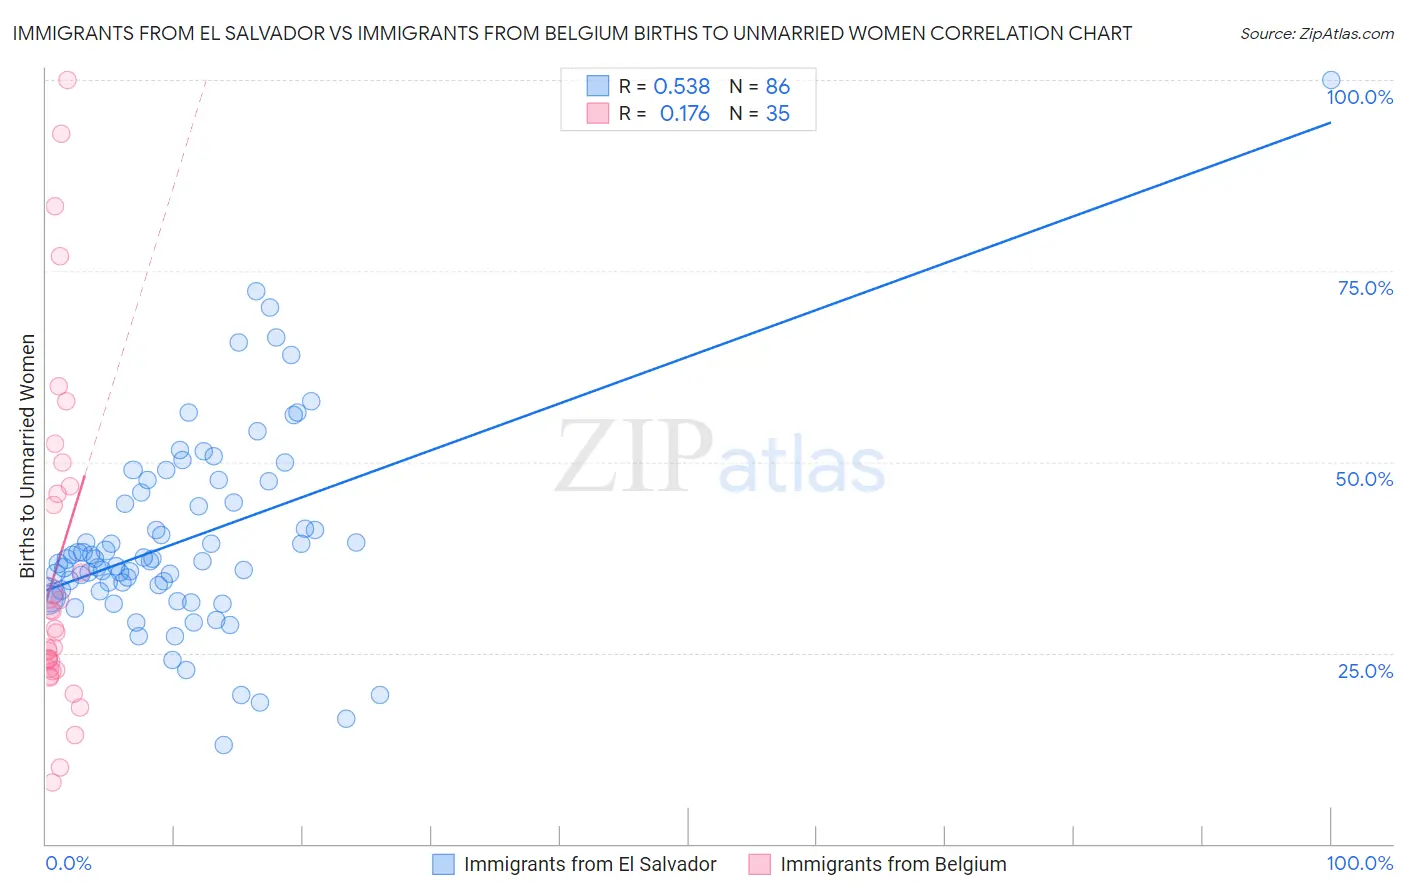
Immigrants from El Salvador vs Immigrants from Belgium Births to Unmarried Women Correlation Chart
The statistical analysis conducted on geographies consisting of 341,352,792 people shows a substantial positive correlation between the proportion of Immigrants from El Salvador and percentage of births to unmarried women in the United States with a correlation coefficient (R) of 0.538 and weighted average of 36.4%. Similarly, the statistical analysis conducted on geographies consisting of 139,482,659 people shows a poor positive correlation between the proportion of Immigrants from Belgium and percentage of births to unmarried women in the United States with a correlation coefficient (R) of 0.176 and weighted average of 28.0%, a difference of 30.2%.
Births to Unmarried Women Correlation Summary
| Measurement | Immigrants from El Salvador | Immigrants from Belgium |
| Minimum | 12.9% | 8.0% |
| Maximum | 100.0% | 100.0% |
| Range | 87.1% | 92.0% |
| Mean | 39.8% | 36.6% |
| Median | 37.1% | 27.6% |
| Interquartile 25% (IQ1) | 33.0% | 22.8% |
| Interquartile 75% (IQ3) | 45.9% | 46.8% |
| Interquartile Range (IQR) | 12.9% | 24.0% |
| Standard Deviation (Sample) | 13.2% | 22.8% |
| Standard Deviation (Population) | 13.2% | 22.4% |
Similar Demographics by Births to Unmarried Women
Demographics Similar to Immigrants from El Salvador by Births to Unmarried Women
In terms of births to unmarried women, the demographic groups most similar to Immigrants from El Salvador are American (36.4%, a difference of 0.050%), Ottawa (36.5%, a difference of 0.12%), Trinidadian and Tobagonian (36.5%, a difference of 0.12%), Immigrants from Grenada (36.3%, a difference of 0.33%), and Chickasaw (36.3%, a difference of 0.36%).
| Demographics | Rating | Rank | Births to Unmarried Women |
| Salvadorans | 0.3 /100 | #252 | Tragic 36.0% |
| Immigrants | Portugal | 0.2 /100 | #253 | Tragic 36.2% |
| Potawatomi | 0.2 /100 | #254 | Tragic 36.2% |
| Chickasaw | 0.2 /100 | #255 | Tragic 36.3% |
| Immigrants | Trinidad and Tobago | 0.2 /100 | #256 | Tragic 36.3% |
| Immigrants | Grenada | 0.2 /100 | #257 | Tragic 36.3% |
| Americans | 0.2 /100 | #258 | Tragic 36.4% |
| Immigrants | El Salvador | 0.2 /100 | #259 | Tragic 36.4% |
| Ottawa | 0.2 /100 | #260 | Tragic 36.5% |
| Trinidadians and Tobagonians | 0.2 /100 | #261 | Tragic 36.5% |
| French American Indians | 0.1 /100 | #262 | Tragic 36.6% |
| Nicaraguans | 0.1 /100 | #263 | Tragic 36.6% |
| Sub-Saharan Africans | 0.1 /100 | #264 | Tragic 36.7% |
| Cherokee | 0.1 /100 | #265 | Tragic 36.7% |
| Immigrants | Senegal | 0.1 /100 | #266 | Tragic 36.7% |
Demographics Similar to Immigrants from Belgium by Births to Unmarried Women
In terms of births to unmarried women, the demographic groups most similar to Immigrants from Belgium are Russian (28.0%, a difference of 0.13%), Immigrants from Albania (28.0%, a difference of 0.24%), Mongolian (27.9%, a difference of 0.26%), Afghan (27.9%, a difference of 0.30%), and Immigrants from Romania (27.9%, a difference of 0.37%).
| Demographics | Rating | Rank | Births to Unmarried Women |
| Immigrants | Greece | 99.4 /100 | #49 | Exceptional 27.8% |
| Maltese | 99.4 /100 | #50 | Exceptional 27.8% |
| Macedonians | 99.4 /100 | #51 | Exceptional 27.9% |
| Bhutanese | 99.4 /100 | #52 | Exceptional 27.9% |
| Immigrants | Romania | 99.4 /100 | #53 | Exceptional 27.9% |
| Afghans | 99.4 /100 | #54 | Exceptional 27.9% |
| Mongolians | 99.3 /100 | #55 | Exceptional 27.9% |
| Immigrants | Belgium | 99.3 /100 | #56 | Exceptional 28.0% |
| Russians | 99.2 /100 | #57 | Exceptional 28.0% |
| Immigrants | Albania | 99.2 /100 | #58 | Exceptional 28.0% |
| Immigrants | Kazakhstan | 99.1 /100 | #59 | Exceptional 28.1% |
| Immigrants | Turkey | 99.1 /100 | #60 | Exceptional 28.1% |
| Immigrants | North Macedonia | 99.1 /100 | #61 | Exceptional 28.1% |
| Egyptians | 99.0 /100 | #62 | Exceptional 28.2% |
| Immigrants | Serbia | 98.9 /100 | #63 | Exceptional 28.3% |