Immigrants from El Salvador vs Russian Married-couple Households
COMPARE
Immigrants from El Salvador
Russian
Married-couple Households
Married-couple Households Comparison
Immigrants from El Salvador
Russians
44.3%
MARRIED-COUPLE HOUSEHOLDS
0.7/ 100
METRIC RATING
245th/ 347
METRIC RANK
48.2%
MARRIED-COUPLE HOUSEHOLDS
98.1/ 100
METRIC RATING
80th/ 347
METRIC RANK
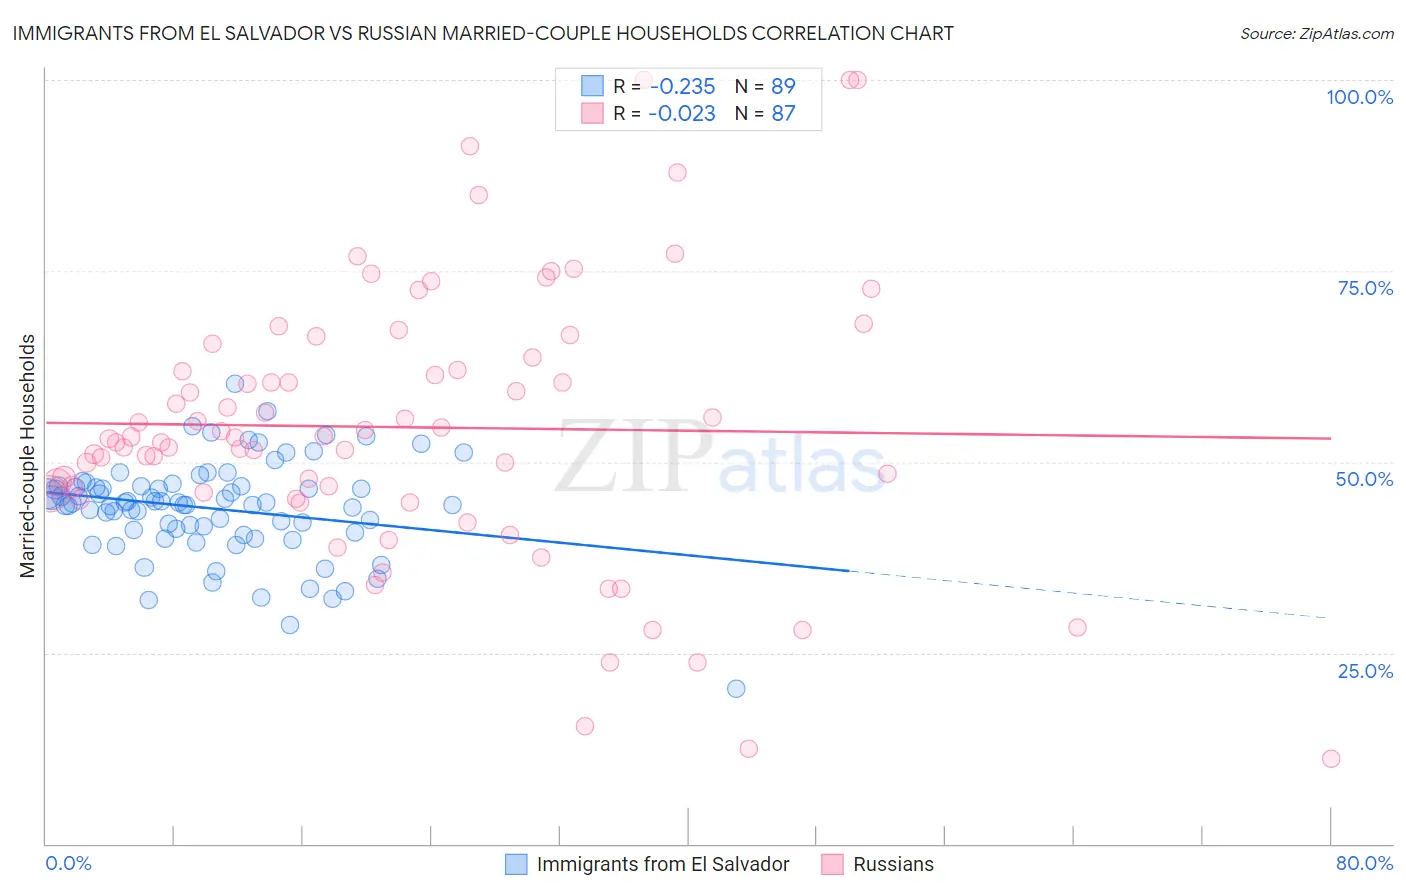
Immigrants from El Salvador vs Russian Married-couple Households Correlation Chart
The statistical analysis conducted on geographies consisting of 357,701,715 people shows a weak negative correlation between the proportion of Immigrants from El Salvador and percentage of married-couple family households in the United States with a correlation coefficient (R) of -0.235 and weighted average of 44.3%. Similarly, the statistical analysis conducted on geographies consisting of 511,711,387 people shows no correlation between the proportion of Russians and percentage of married-couple family households in the United States with a correlation coefficient (R) of -0.023 and weighted average of 48.2%, a difference of 8.8%.
Married-couple Households Correlation Summary
| Measurement | Immigrants from El Salvador | Russian |
| Minimum | 20.3% | 11.1% |
| Maximum | 60.3% | 100.0% |
| Range | 40.0% | 88.9% |
| Mean | 43.9% | 54.5% |
| Median | 44.6% | 53.3% |
| Interquartile 25% (IQ1) | 40.9% | 45.9% |
| Interquartile 75% (IQ3) | 46.8% | 63.7% |
| Interquartile Range (IQR) | 6.0% | 17.8% |
| Standard Deviation (Sample) | 6.4% | 17.9% |
| Standard Deviation (Population) | 6.3% | 17.8% |
Similar Demographics by Married-couple Households
Demographics Similar to Immigrants from El Salvador by Married-couple Households
In terms of married-couple households, the demographic groups most similar to Immigrants from El Salvador are Immigrants from Armenia (44.3%, a difference of 0.010%), Immigrants from Cuba (44.2%, a difference of 0.15%), Immigrants from Morocco (44.2%, a difference of 0.15%), Immigrants from Saudi Arabia (44.4%, a difference of 0.29%), and Immigrants from Albania (44.4%, a difference of 0.36%).
| Demographics | Rating | Rank | Married-couple Households |
| Immigrants | Uruguay | 1.1 /100 | #238 | Tragic 44.5% |
| Spanish Americans | 1.1 /100 | #239 | Tragic 44.5% |
| Ute | 1.0 /100 | #240 | Tragic 44.4% |
| Immigrants | Bosnia and Herzegovina | 1.0 /100 | #241 | Tragic 44.4% |
| Immigrants | Albania | 1.0 /100 | #242 | Tragic 44.4% |
| Immigrants | Saudi Arabia | 0.9 /100 | #243 | Tragic 44.4% |
| Immigrants | Armenia | 0.7 /100 | #244 | Tragic 44.3% |
| Immigrants | El Salvador | 0.7 /100 | #245 | Tragic 44.3% |
| Immigrants | Cuba | 0.6 /100 | #246 | Tragic 44.2% |
| Immigrants | Morocco | 0.6 /100 | #247 | Tragic 44.2% |
| Yup'ik | 0.4 /100 | #248 | Tragic 44.1% |
| Immigrants | Kenya | 0.4 /100 | #249 | Tragic 44.1% |
| French American Indians | 0.4 /100 | #250 | Tragic 44.1% |
| German Russians | 0.4 /100 | #251 | Tragic 44.0% |
| Seminole | 0.4 /100 | #252 | Tragic 44.0% |
Demographics Similar to Russians by Married-couple Households
In terms of married-couple households, the demographic groups most similar to Russians are Immigrants from Netherlands (48.2%, a difference of 0.020%), Egyptian (48.2%, a difference of 0.030%), Canadian (48.2%, a difference of 0.050%), Finnish (48.1%, a difference of 0.060%), and Immigrants from England (48.2%, a difference of 0.15%).
| Demographics | Rating | Rank | Married-couple Households |
| Immigrants | Singapore | 98.6 /100 | #73 | Exceptional 48.3% |
| Immigrants | Romania | 98.6 /100 | #74 | Exceptional 48.3% |
| Immigrants | England | 98.4 /100 | #75 | Exceptional 48.2% |
| Immigrants | Fiji | 98.4 /100 | #76 | Exceptional 48.2% |
| Canadians | 98.2 /100 | #77 | Exceptional 48.2% |
| Egyptians | 98.2 /100 | #78 | Exceptional 48.2% |
| Immigrants | Netherlands | 98.2 /100 | #79 | Exceptional 48.2% |
| Russians | 98.1 /100 | #80 | Exceptional 48.2% |
| Finns | 98.0 /100 | #81 | Exceptional 48.1% |
| Immigrants | Poland | 97.7 /100 | #82 | Exceptional 48.1% |
| Guamanians/Chamorros | 97.6 /100 | #83 | Exceptional 48.1% |
| Ukrainians | 97.6 /100 | #84 | Exceptional 48.1% |
| Immigrants | Israel | 97.4 /100 | #85 | Exceptional 48.0% |
| Belgians | 97.4 /100 | #86 | Exceptional 48.0% |
| Immigrants | Ireland | 97.3 /100 | #87 | Exceptional 48.0% |