Immigrants from El Salvador vs Russian Associate's Degree
COMPARE
Immigrants from El Salvador
Russian
Associate's Degree
Associate's Degree Comparison
Immigrants from El Salvador
Russians
38.4%
ASSOCIATE'S DEGREE
0.0/ 100
METRIC RATING
307th/ 347
METRIC RANK
53.2%
ASSOCIATE'S DEGREE
100.0/ 100
METRIC RATING
35th/ 347
METRIC RANK
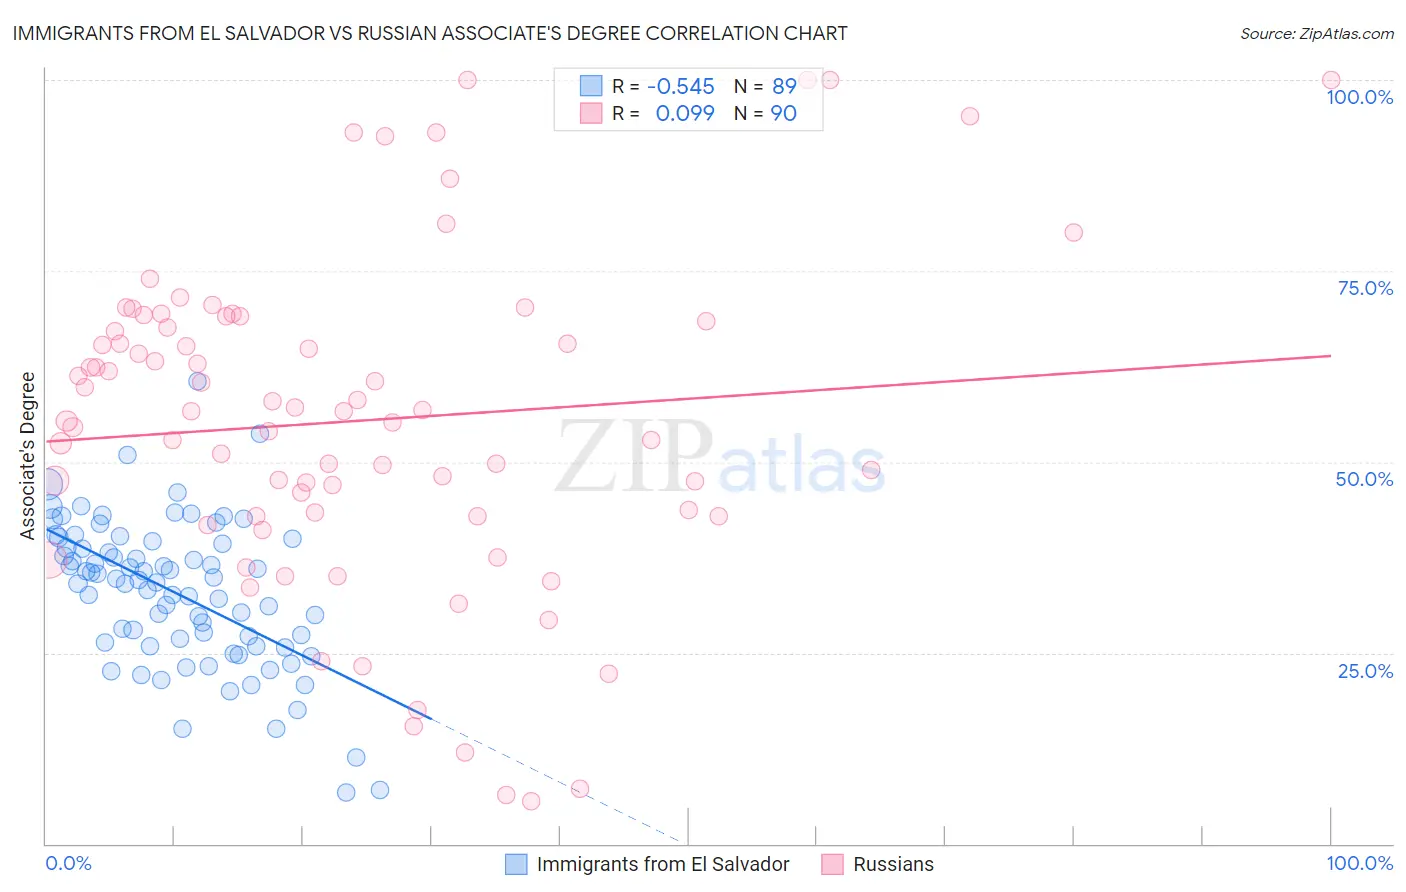
Immigrants from El Salvador vs Russian Associate's Degree Correlation Chart
The statistical analysis conducted on geographies consisting of 357,840,012 people shows a substantial negative correlation between the proportion of Immigrants from El Salvador and percentage of population with at least associate's degree education in the United States with a correlation coefficient (R) of -0.545 and weighted average of 38.4%. Similarly, the statistical analysis conducted on geographies consisting of 512,209,602 people shows a slight positive correlation between the proportion of Russians and percentage of population with at least associate's degree education in the United States with a correlation coefficient (R) of 0.099 and weighted average of 53.2%, a difference of 38.6%.
Associate's Degree Correlation Summary
| Measurement | Immigrants from El Salvador | Russian |
| Minimum | 6.6% | 5.6% |
| Maximum | 60.5% | 100.0% |
| Range | 53.9% | 94.4% |
| Mean | 32.9% | 55.4% |
| Median | 34.5% | 56.6% |
| Interquartile 25% (IQ1) | 26.1% | 42.9% |
| Interquartile 75% (IQ3) | 39.4% | 68.4% |
| Interquartile Range (IQR) | 13.3% | 25.5% |
| Standard Deviation (Sample) | 9.6% | 21.5% |
| Standard Deviation (Population) | 9.6% | 21.3% |
Similar Demographics by Associate's Degree
Demographics Similar to Immigrants from El Salvador by Associate's Degree
In terms of associate's degree, the demographic groups most similar to Immigrants from El Salvador are Shoshone (38.4%, a difference of 0.040%), Immigrants from Honduras (38.5%, a difference of 0.11%), Sioux (38.5%, a difference of 0.17%), Guatemalan (38.5%, a difference of 0.23%), and Colville (38.5%, a difference of 0.31%).
| Demographics | Rating | Rank | Associate's Degree |
| Chickasaw | 0.0 /100 | #300 | Tragic 38.6% |
| Tsimshian | 0.0 /100 | #301 | Tragic 38.6% |
| Colville | 0.0 /100 | #302 | Tragic 38.5% |
| Guatemalans | 0.0 /100 | #303 | Tragic 38.5% |
| Sioux | 0.0 /100 | #304 | Tragic 38.5% |
| Immigrants | Honduras | 0.0 /100 | #305 | Tragic 38.5% |
| Shoshone | 0.0 /100 | #306 | Tragic 38.4% |
| Immigrants | El Salvador | 0.0 /100 | #307 | Tragic 38.4% |
| Mexican American Indians | 0.0 /100 | #308 | Tragic 38.2% |
| Immigrants | Guatemala | 0.0 /100 | #309 | Tragic 38.1% |
| Immigrants | Dominican Republic | 0.0 /100 | #310 | Tragic 37.9% |
| Immigrants | Latin America | 0.0 /100 | #311 | Tragic 37.9% |
| Choctaw | 0.0 /100 | #312 | Tragic 37.8% |
| Hispanics or Latinos | 0.0 /100 | #313 | Tragic 37.7% |
| Seminole | 0.0 /100 | #314 | Tragic 37.7% |
Demographics Similar to Russians by Associate's Degree
In terms of associate's degree, the demographic groups most similar to Russians are Bulgarian (53.3%, a difference of 0.060%), Israeli (53.4%, a difference of 0.26%), Immigrants from Russia (53.1%, a difference of 0.28%), Immigrants from Denmark (53.1%, a difference of 0.36%), and Immigrants from Turkey (53.4%, a difference of 0.38%).
| Demographics | Rating | Rank | Associate's Degree |
| Turks | 100.0 /100 | #28 | Exceptional 53.9% |
| Immigrants | France | 100.0 /100 | #29 | Exceptional 53.9% |
| Immigrants | Sri Lanka | 100.0 /100 | #30 | Exceptional 53.7% |
| Immigrants | Northern Europe | 100.0 /100 | #31 | Exceptional 53.5% |
| Immigrants | Turkey | 100.0 /100 | #32 | Exceptional 53.4% |
| Israelis | 100.0 /100 | #33 | Exceptional 53.4% |
| Bulgarians | 100.0 /100 | #34 | Exceptional 53.3% |
| Russians | 100.0 /100 | #35 | Exceptional 53.2% |
| Immigrants | Russia | 100.0 /100 | #36 | Exceptional 53.1% |
| Immigrants | Denmark | 100.0 /100 | #37 | Exceptional 53.1% |
| Mongolians | 100.0 /100 | #38 | Exceptional 53.0% |
| Immigrants | Belarus | 99.9 /100 | #39 | Exceptional 52.8% |
| Immigrants | Latvia | 99.9 /100 | #40 | Exceptional 52.8% |
| Immigrants | Saudi Arabia | 99.9 /100 | #41 | Exceptional 52.6% |
| Immigrants | Malaysia | 99.9 /100 | #42 | Exceptional 52.5% |