Immigrants from El Salvador vs Russian In Labor Force | Age 25-29
COMPARE
Immigrants from El Salvador
Russian
In Labor Force | Age 25-29
In Labor Force | Age 25-29 Comparison
Immigrants from El Salvador
Russians
83.7%
IN LABOR FORCE | AGE 25-29
0.3/ 100
METRIC RATING
247th/ 347
METRIC RANK
85.3%
IN LABOR FORCE | AGE 25-29
98.8/ 100
METRIC RATING
73rd/ 347
METRIC RANK
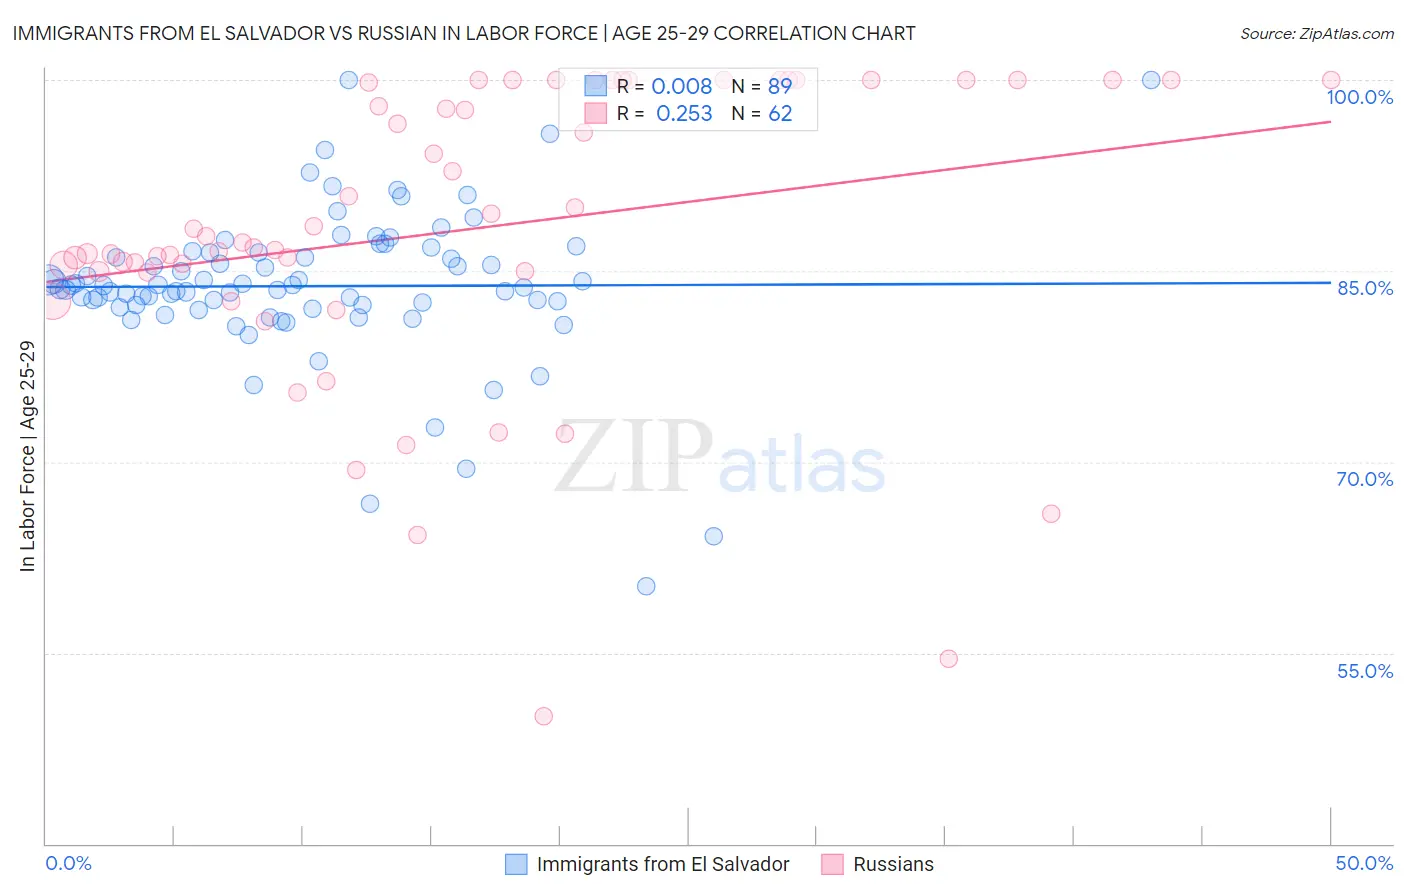
Immigrants from El Salvador vs Russian In Labor Force | Age 25-29 Correlation Chart
The statistical analysis conducted on geographies consisting of 357,714,097 people shows no correlation between the proportion of Immigrants from El Salvador and labor force participation rate among population between the ages 25 and 29 in the United States with a correlation coefficient (R) of 0.008 and weighted average of 83.7%. Similarly, the statistical analysis conducted on geographies consisting of 511,687,113 people shows a weak positive correlation between the proportion of Russians and labor force participation rate among population between the ages 25 and 29 in the United States with a correlation coefficient (R) of 0.253 and weighted average of 85.3%, a difference of 1.9%.
In Labor Force | Age 25-29 Correlation Summary
| Measurement | Immigrants from El Salvador | Russian |
| Minimum | 60.2% | 50.0% |
| Maximum | 100.0% | 100.0% |
| Range | 39.8% | 50.0% |
| Mean | 83.8% | 88.2% |
| Median | 83.6% | 87.5% |
| Interquartile 25% (IQ1) | 82.2% | 85.0% |
| Interquartile 75% (IQ3) | 86.5% | 100.0% |
| Interquartile Range (IQR) | 4.2% | 15.0% |
| Standard Deviation (Sample) | 6.0% | 11.7% |
| Standard Deviation (Population) | 6.0% | 11.6% |
Similar Demographics by In Labor Force | Age 25-29
Demographics Similar to Immigrants from El Salvador by In Labor Force | Age 25-29
In terms of in labor force | age 25-29, the demographic groups most similar to Immigrants from El Salvador are Cree (83.8%, a difference of 0.020%), Nonimmigrants (83.7%, a difference of 0.020%), Hmong (83.7%, a difference of 0.030%), Central American (83.7%, a difference of 0.040%), and Bahamian (83.7%, a difference of 0.060%).
| Demographics | Rating | Rank | In Labor Force | Age 25-29 |
| Trinidadians and Tobagonians | 0.7 /100 | #240 | Tragic 83.9% |
| Alsatians | 0.7 /100 | #241 | Tragic 83.9% |
| U.S. Virgin Islanders | 0.6 /100 | #242 | Tragic 83.8% |
| Salvadorans | 0.5 /100 | #243 | Tragic 83.8% |
| Immigrants | Jamaica | 0.4 /100 | #244 | Tragic 83.8% |
| Iroquois | 0.4 /100 | #245 | Tragic 83.8% |
| Cree | 0.3 /100 | #246 | Tragic 83.8% |
| Immigrants | El Salvador | 0.3 /100 | #247 | Tragic 83.7% |
| Immigrants | Nonimmigrants | 0.3 /100 | #248 | Tragic 83.7% |
| Hmong | 0.3 /100 | #249 | Tragic 83.7% |
| Central Americans | 0.2 /100 | #250 | Tragic 83.7% |
| Bahamians | 0.2 /100 | #251 | Tragic 83.7% |
| Guatemalans | 0.2 /100 | #252 | Tragic 83.7% |
| Immigrants | Trinidad and Tobago | 0.2 /100 | #253 | Tragic 83.7% |
| Spaniards | 0.2 /100 | #254 | Tragic 83.7% |
Demographics Similar to Russians by In Labor Force | Age 25-29
In terms of in labor force | age 25-29, the demographic groups most similar to Russians are Immigrants from Australia (85.3%, a difference of 0.010%), Kenyan (85.4%, a difference of 0.030%), Immigrants from Sweden (85.4%, a difference of 0.040%), Soviet Union (85.3%, a difference of 0.040%), and Menominee (85.4%, a difference of 0.050%).
| Demographics | Rating | Rank | In Labor Force | Age 25-29 |
| Immigrants | Scotland | 99.3 /100 | #66 | Exceptional 85.4% |
| Immigrants | Turkey | 99.2 /100 | #67 | Exceptional 85.4% |
| Immigrants | Cameroon | 99.2 /100 | #68 | Exceptional 85.4% |
| Menominee | 99.1 /100 | #69 | Exceptional 85.4% |
| Immigrants | Sweden | 99.1 /100 | #70 | Exceptional 85.4% |
| Kenyans | 99.0 /100 | #71 | Exceptional 85.4% |
| Immigrants | Australia | 98.9 /100 | #72 | Exceptional 85.3% |
| Russians | 98.8 /100 | #73 | Exceptional 85.3% |
| Soviet Union | 98.5 /100 | #74 | Exceptional 85.3% |
| Brazilians | 98.3 /100 | #75 | Exceptional 85.3% |
| Germans | 98.1 /100 | #76 | Exceptional 85.3% |
| Immigrants | South Central Asia | 97.9 /100 | #77 | Exceptional 85.2% |
| Immigrants | Egypt | 97.7 /100 | #78 | Exceptional 85.2% |
| Immigrants | Northern Africa | 97.6 /100 | #79 | Exceptional 85.2% |
| Immigrants | Zimbabwe | 97.6 /100 | #80 | Exceptional 85.2% |