Immigrants from Ecuador vs American Family Households
COMPARE
Immigrants from Ecuador
American
Family Households
Family Households Comparison
Immigrants from Ecuador
Americans
64.8%
FAMILY HOUSEHOLDS
91.4/ 100
METRIC RATING
129th/ 347
METRIC RANK
65.5%
FAMILY HOUSEHOLDS
99.6/ 100
METRIC RATING
84th/ 347
METRIC RANK
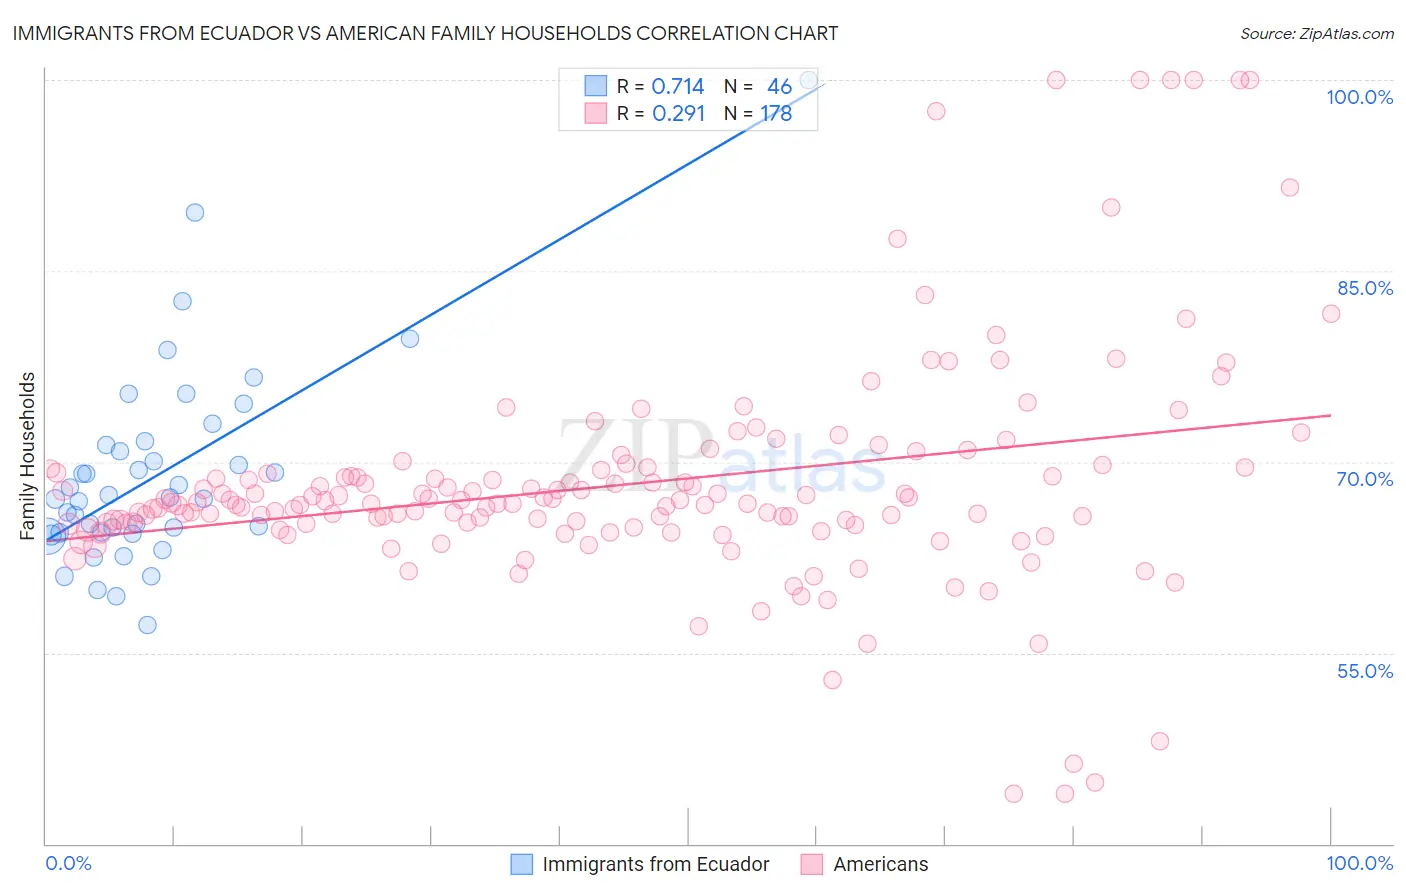
Immigrants from Ecuador vs American Family Households Correlation Chart
The statistical analysis conducted on geographies consisting of 270,888,190 people shows a strong positive correlation between the proportion of Immigrants from Ecuador and percentage of family households in the United States with a correlation coefficient (R) of 0.714 and weighted average of 64.8%. Similarly, the statistical analysis conducted on geographies consisting of 581,387,036 people shows a weak positive correlation between the proportion of Americans and percentage of family households in the United States with a correlation coefficient (R) of 0.291 and weighted average of 65.5%, a difference of 1.1%.
Family Households Correlation Summary
| Measurement | Immigrants from Ecuador | American |
| Minimum | 57.2% | 43.9% |
| Maximum | 100.0% | 100.0% |
| Range | 42.8% | 56.1% |
| Mean | 69.0% | 68.2% |
| Median | 67.2% | 66.7% |
| Interquartile 25% (IQ1) | 64.4% | 65.1% |
| Interquartile 75% (IQ3) | 71.4% | 69.3% |
| Interquartile Range (IQR) | 7.0% | 4.2% |
| Standard Deviation (Sample) | 7.8% | 9.1% |
| Standard Deviation (Population) | 7.8% | 9.1% |
Similar Demographics by Family Households
Demographics Similar to Immigrants from Ecuador by Family Households
In terms of family households, the demographic groups most similar to Immigrants from Ecuador are Italian (64.8%, a difference of 0.020%), Immigrants from Panama (64.8%, a difference of 0.030%), Panamanian (64.8%, a difference of 0.050%), Immigrants from Italy (64.8%, a difference of 0.050%), and Nonimmigrants (64.8%, a difference of 0.050%).
| Demographics | Rating | Rank | Family Households |
| Hmong | 93.4 /100 | #122 | Exceptional 64.9% |
| Choctaw | 93.4 /100 | #123 | Exceptional 64.9% |
| Immigrants | Argentina | 92.8 /100 | #124 | Exceptional 64.9% |
| Immigrants | Belize | 92.7 /100 | #125 | Exceptional 64.9% |
| Panamanians | 92.4 /100 | #126 | Exceptional 64.8% |
| Immigrants | Panama | 92.0 /100 | #127 | Exceptional 64.8% |
| Italians | 91.9 /100 | #128 | Exceptional 64.8% |
| Immigrants | Ecuador | 91.4 /100 | #129 | Exceptional 64.8% |
| Immigrants | Italy | 90.2 /100 | #130 | Exceptional 64.8% |
| Immigrants | Nonimmigrants | 90.1 /100 | #131 | Exceptional 64.8% |
| Cajuns | 89.4 /100 | #132 | Excellent 64.8% |
| Belizeans | 89.3 /100 | #133 | Excellent 64.8% |
| Greeks | 88.1 /100 | #134 | Excellent 64.7% |
| Maltese | 87.4 /100 | #135 | Excellent 64.7% |
| Immigrants | China | 86.6 /100 | #136 | Excellent 64.7% |
Demographics Similar to Americans by Family Households
In terms of family households, the demographic groups most similar to Americans are Immigrants from Guyana (65.5%, a difference of 0.020%), Immigrants from Lebanon (65.5%, a difference of 0.030%), Jordanian (65.5%, a difference of 0.060%), Immigrants from Cambodia (65.4%, a difference of 0.11%), and Puget Sound Salish (65.6%, a difference of 0.14%).
| Demographics | Rating | Rank | Family Households |
| Immigrants | South America | 99.8 /100 | #77 | Exceptional 65.6% |
| Yaqui | 99.8 /100 | #78 | Exceptional 65.6% |
| Immigrants | Costa Rica | 99.8 /100 | #79 | Exceptional 65.6% |
| Puget Sound Salish | 99.8 /100 | #80 | Exceptional 65.6% |
| Jordanians | 99.7 /100 | #81 | Exceptional 65.5% |
| Immigrants | Lebanon | 99.7 /100 | #82 | Exceptional 65.5% |
| Immigrants | Guyana | 99.6 /100 | #83 | Exceptional 65.5% |
| Americans | 99.6 /100 | #84 | Exceptional 65.5% |
| Immigrants | Cambodia | 99.5 /100 | #85 | Exceptional 65.4% |
| Egyptians | 99.4 /100 | #86 | Exceptional 65.4% |
| Immigrants | Egypt | 99.2 /100 | #87 | Exceptional 65.3% |
| Immigrants | Haiti | 99.1 /100 | #88 | Exceptional 65.3% |
| Immigrants | Caribbean | 99.1 /100 | #89 | Exceptional 65.3% |
| Immigrants | Laos | 99.1 /100 | #90 | Exceptional 65.3% |
| Crow | 98.9 /100 | #91 | Exceptional 65.3% |