Immigrants from Ecuador vs Chippewa Family Households
COMPARE
Immigrants from Ecuador
Chippewa
Family Households
Family Households Comparison
Immigrants from Ecuador
Chippewa
64.8%
FAMILY HOUSEHOLDS
91.4/ 100
METRIC RATING
129th/ 347
METRIC RANK
62.1%
FAMILY HOUSEHOLDS
0.0/ 100
METRIC RATING
308th/ 347
METRIC RANK
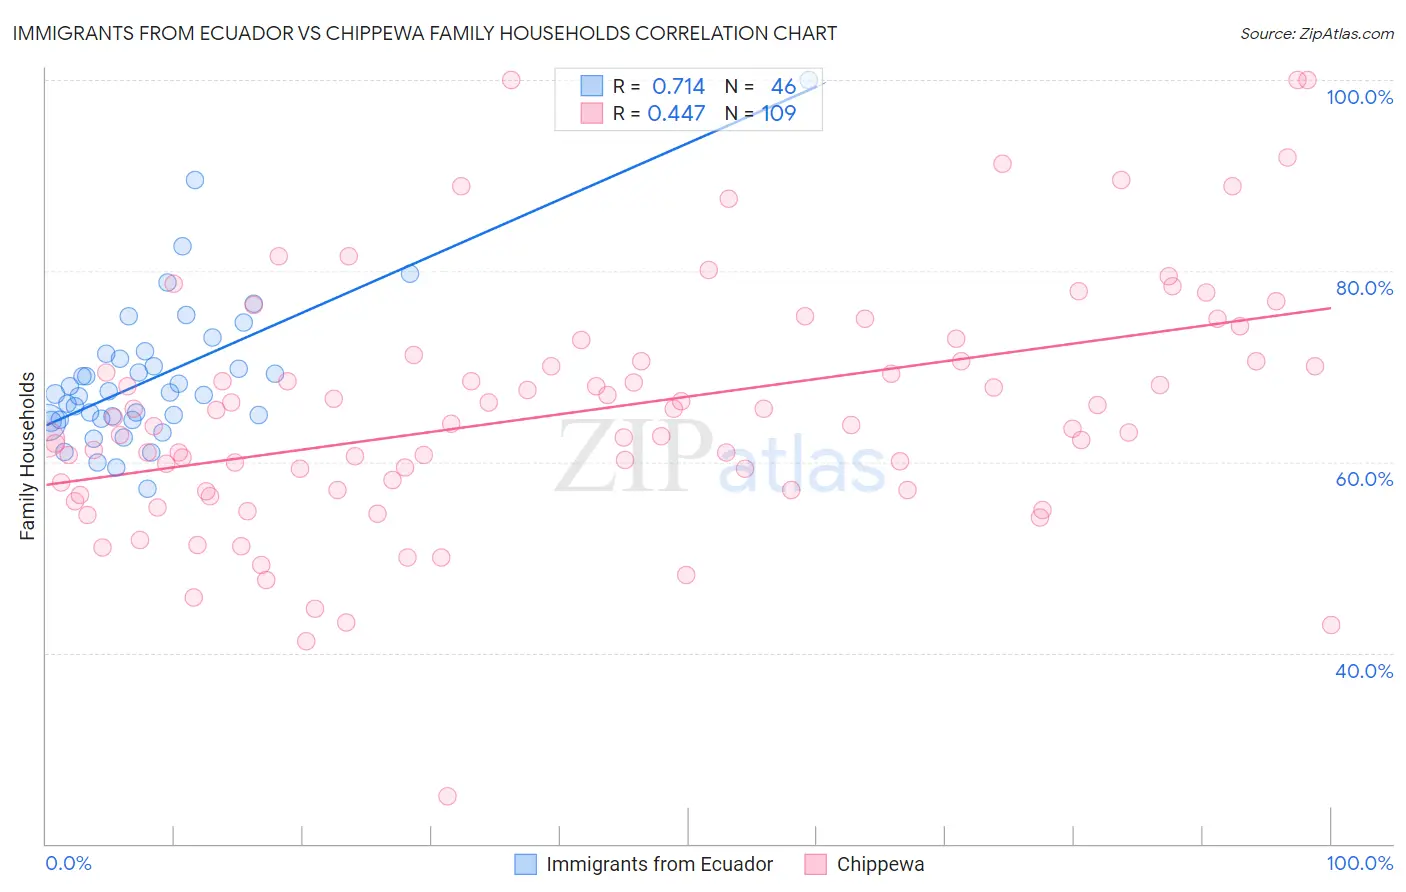
Immigrants from Ecuador vs Chippewa Family Households Correlation Chart
The statistical analysis conducted on geographies consisting of 270,888,190 people shows a strong positive correlation between the proportion of Immigrants from Ecuador and percentage of family households in the United States with a correlation coefficient (R) of 0.714 and weighted average of 64.8%. Similarly, the statistical analysis conducted on geographies consisting of 215,001,181 people shows a moderate positive correlation between the proportion of Chippewa and percentage of family households in the United States with a correlation coefficient (R) of 0.447 and weighted average of 62.1%, a difference of 4.4%.
Family Households Correlation Summary
| Measurement | Immigrants from Ecuador | Chippewa |
| Minimum | 57.2% | 25.0% |
| Maximum | 100.0% | 100.0% |
| Range | 42.8% | 75.0% |
| Mean | 69.0% | 65.2% |
| Median | 67.2% | 63.9% |
| Interquartile 25% (IQ1) | 64.4% | 57.0% |
| Interquartile 75% (IQ3) | 71.4% | 70.6% |
| Interquartile Range (IQR) | 7.0% | 13.5% |
| Standard Deviation (Sample) | 7.8% | 12.8% |
| Standard Deviation (Population) | 7.8% | 12.7% |
Similar Demographics by Family Households
Demographics Similar to Immigrants from Ecuador by Family Households
In terms of family households, the demographic groups most similar to Immigrants from Ecuador are Italian (64.8%, a difference of 0.020%), Immigrants from Panama (64.8%, a difference of 0.030%), Panamanian (64.8%, a difference of 0.050%), Immigrants from Italy (64.8%, a difference of 0.050%), and Nonimmigrants (64.8%, a difference of 0.050%).
| Demographics | Rating | Rank | Family Households |
| Hmong | 93.4 /100 | #122 | Exceptional 64.9% |
| Choctaw | 93.4 /100 | #123 | Exceptional 64.9% |
| Immigrants | Argentina | 92.8 /100 | #124 | Exceptional 64.9% |
| Immigrants | Belize | 92.7 /100 | #125 | Exceptional 64.9% |
| Panamanians | 92.4 /100 | #126 | Exceptional 64.8% |
| Immigrants | Panama | 92.0 /100 | #127 | Exceptional 64.8% |
| Italians | 91.9 /100 | #128 | Exceptional 64.8% |
| Immigrants | Ecuador | 91.4 /100 | #129 | Exceptional 64.8% |
| Immigrants | Italy | 90.2 /100 | #130 | Exceptional 64.8% |
| Immigrants | Nonimmigrants | 90.1 /100 | #131 | Exceptional 64.8% |
| Cajuns | 89.4 /100 | #132 | Excellent 64.8% |
| Belizeans | 89.3 /100 | #133 | Excellent 64.8% |
| Greeks | 88.1 /100 | #134 | Excellent 64.7% |
| Maltese | 87.4 /100 | #135 | Excellent 64.7% |
| Immigrants | China | 86.6 /100 | #136 | Excellent 64.7% |
Demographics Similar to Chippewa by Family Households
In terms of family households, the demographic groups most similar to Chippewa are Immigrants from Norway (62.1%, a difference of 0.0%), Subsaharan African (62.1%, a difference of 0.050%), African (62.1%, a difference of 0.080%), Bermudan (62.2%, a difference of 0.10%), and Immigrants from Liberia (62.0%, a difference of 0.10%).
| Demographics | Rating | Rank | Family Households |
| Immigrants | Albania | 0.0 /100 | #301 | Tragic 62.4% |
| Immigrants | Kenya | 0.0 /100 | #302 | Tragic 62.3% |
| Cree | 0.0 /100 | #303 | Tragic 62.3% |
| Iroquois | 0.0 /100 | #304 | Tragic 62.2% |
| Bermudans | 0.0 /100 | #305 | Tragic 62.2% |
| Africans | 0.0 /100 | #306 | Tragic 62.1% |
| Immigrants | Norway | 0.0 /100 | #307 | Tragic 62.1% |
| Chippewa | 0.0 /100 | #308 | Tragic 62.1% |
| Sub-Saharan Africans | 0.0 /100 | #309 | Tragic 62.1% |
| Immigrants | Liberia | 0.0 /100 | #310 | Tragic 62.0% |
| Immigrants | Morocco | 0.0 /100 | #311 | Tragic 62.0% |
| Immigrants | Latvia | 0.0 /100 | #312 | Tragic 62.0% |
| Liberians | 0.0 /100 | #313 | Tragic 62.0% |
| Immigrants | Cabo Verde | 0.0 /100 | #314 | Tragic 61.9% |
| Moroccans | 0.0 /100 | #315 | Tragic 61.9% |