Immigrants from Ecuador vs Inupiat Currently Married
COMPARE
Immigrants from Ecuador
Inupiat
Currently Married
Currently Married Comparison
Immigrants from Ecuador
Inupiat
43.2%
CURRENTLY MARRIED
0.0/ 100
METRIC RATING
282nd/ 347
METRIC RANK
41.3%
CURRENTLY MARRIED
0.0/ 100
METRIC RATING
315th/ 347
METRIC RANK
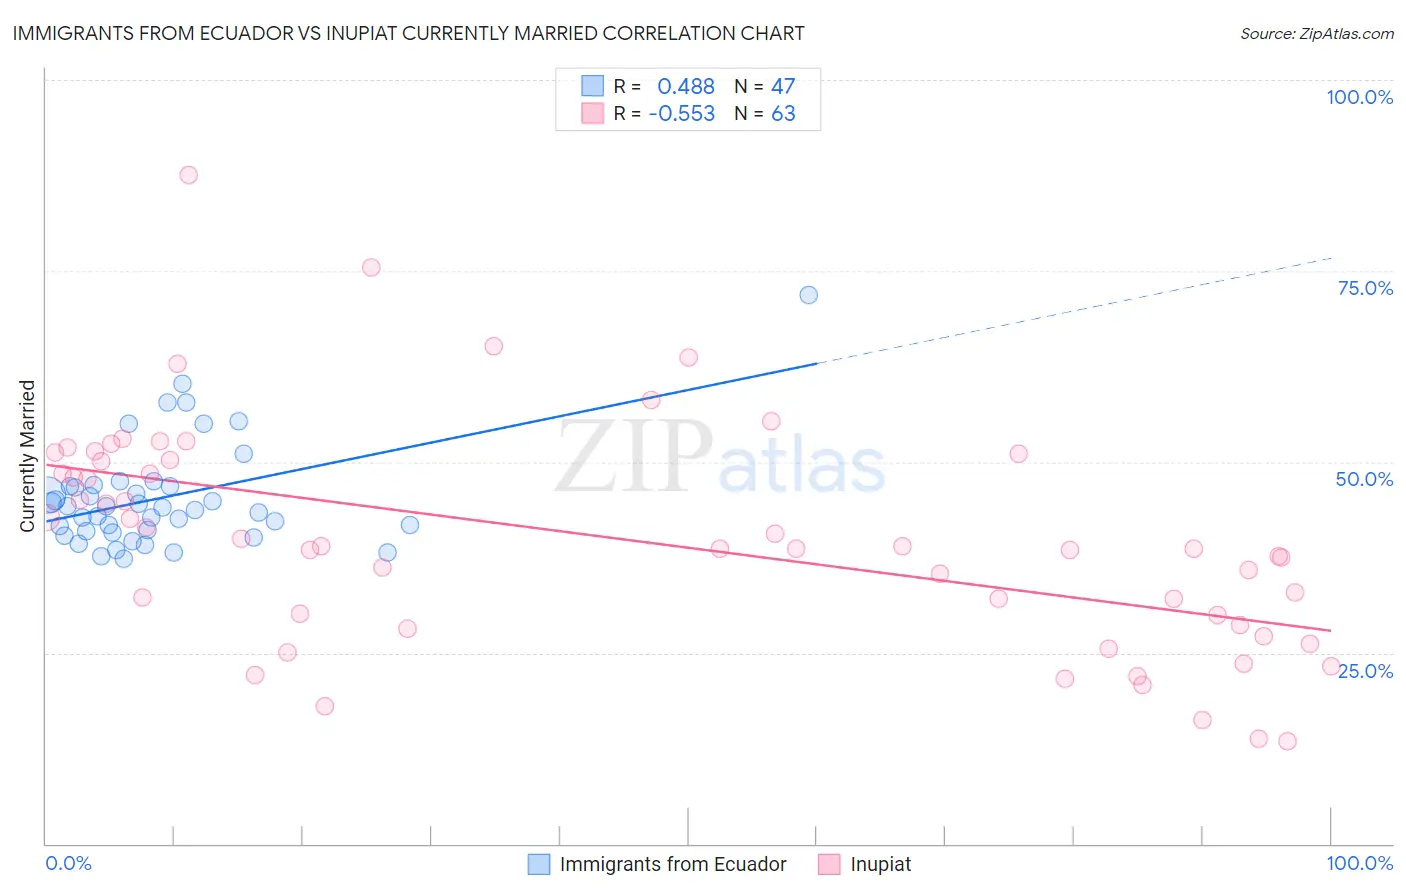
Immigrants from Ecuador vs Inupiat Currently Married Correlation Chart
The statistical analysis conducted on geographies consisting of 270,997,790 people shows a moderate positive correlation between the proportion of Immigrants from Ecuador and percentage of population currently married in the United States with a correlation coefficient (R) of 0.488 and weighted average of 43.2%. Similarly, the statistical analysis conducted on geographies consisting of 96,349,193 people shows a substantial negative correlation between the proportion of Inupiat and percentage of population currently married in the United States with a correlation coefficient (R) of -0.553 and weighted average of 41.3%, a difference of 4.6%.
Currently Married Correlation Summary
| Measurement | Immigrants from Ecuador | Inupiat |
| Minimum | 37.2% | 13.5% |
| Maximum | 71.9% | 87.5% |
| Range | 34.7% | 74.0% |
| Mean | 45.3% | 40.0% |
| Median | 44.1% | 38.7% |
| Interquartile 25% (IQ1) | 40.9% | 28.7% |
| Interquartile 75% (IQ3) | 46.8% | 50.3% |
| Interquartile Range (IQR) | 6.0% | 21.6% |
| Standard Deviation (Sample) | 6.9% | 14.7% |
| Standard Deviation (Population) | 6.8% | 14.6% |
Similar Demographics by Currently Married
Demographics Similar to Immigrants from Ecuador by Currently Married
In terms of currently married, the demographic groups most similar to Immigrants from Ecuador are Chippewa (43.2%, a difference of 0.070%), Apache (43.2%, a difference of 0.080%), Kiowa (43.2%, a difference of 0.11%), Immigrants from El Salvador (43.1%, a difference of 0.12%), and Central American Indian (43.3%, a difference of 0.16%).
| Demographics | Rating | Rank | Currently Married |
| Colville | 0.1 /100 | #275 | Tragic 43.4% |
| Sierra Leoneans | 0.1 /100 | #276 | Tragic 43.4% |
| Immigrants | Nigeria | 0.1 /100 | #277 | Tragic 43.4% |
| Central Americans | 0.0 /100 | #278 | Tragic 43.3% |
| Central American Indians | 0.0 /100 | #279 | Tragic 43.3% |
| Apache | 0.0 /100 | #280 | Tragic 43.2% |
| Chippewa | 0.0 /100 | #281 | Tragic 43.2% |
| Immigrants | Ecuador | 0.0 /100 | #282 | Tragic 43.2% |
| Kiowa | 0.0 /100 | #283 | Tragic 43.2% |
| Immigrants | El Salvador | 0.0 /100 | #284 | Tragic 43.1% |
| Immigrants | Middle Africa | 0.0 /100 | #285 | Tragic 43.0% |
| Ghanaians | 0.0 /100 | #286 | Tragic 42.9% |
| Guatemalans | 0.0 /100 | #287 | Tragic 42.9% |
| Natives/Alaskans | 0.0 /100 | #288 | Tragic 42.8% |
| Paiute | 0.0 /100 | #289 | Tragic 42.7% |
Demographics Similar to Inupiat by Currently Married
In terms of currently married, the demographic groups most similar to Inupiat are Immigrants from Caribbean (41.3%, a difference of 0.060%), Haitian (41.3%, a difference of 0.080%), West Indian (41.3%, a difference of 0.090%), Jamaican (41.4%, a difference of 0.16%), and Bahamian (41.2%, a difference of 0.26%).
| Demographics | Rating | Rank | Currently Married |
| Immigrants | Belize | 0.0 /100 | #308 | Tragic 41.8% |
| Immigrants | Liberia | 0.0 /100 | #309 | Tragic 41.8% |
| Guyanese | 0.0 /100 | #310 | Tragic 41.6% |
| Trinidadians and Tobagonians | 0.0 /100 | #311 | Tragic 41.5% |
| Somalis | 0.0 /100 | #312 | Tragic 41.5% |
| Jamaicans | 0.0 /100 | #313 | Tragic 41.4% |
| West Indians | 0.0 /100 | #314 | Tragic 41.3% |
| Inupiat | 0.0 /100 | #315 | Tragic 41.3% |
| Immigrants | Caribbean | 0.0 /100 | #316 | Tragic 41.3% |
| Haitians | 0.0 /100 | #317 | Tragic 41.3% |
| Bahamians | 0.0 /100 | #318 | Tragic 41.2% |
| Immigrants | Somalia | 0.0 /100 | #319 | Tragic 41.2% |
| Immigrants | Jamaica | 0.0 /100 | #320 | Tragic 41.1% |
| Immigrants | Congo | 0.0 /100 | #321 | Tragic 41.1% |
| Immigrants | Haiti | 0.0 /100 | #322 | Tragic 41.0% |