Immigrants from Ecuador vs Inupiat Unemployment Among Seniors over 65 years
COMPARE
Immigrants from Ecuador
Inupiat
Unemployment Among Seniors over 65 years
Unemployment Among Seniors over 65 years Comparison
Immigrants from Ecuador
Inupiat
5.6%
UNEMPLOYMENT AMONG SENIORS OVER 65 YEARS
0.0/ 100
METRIC RATING
312th/ 347
METRIC RANK
5.8%
UNEMPLOYMENT AMONG SENIORS OVER 65 YEARS
0.0/ 100
METRIC RATING
325th/ 347
METRIC RANK
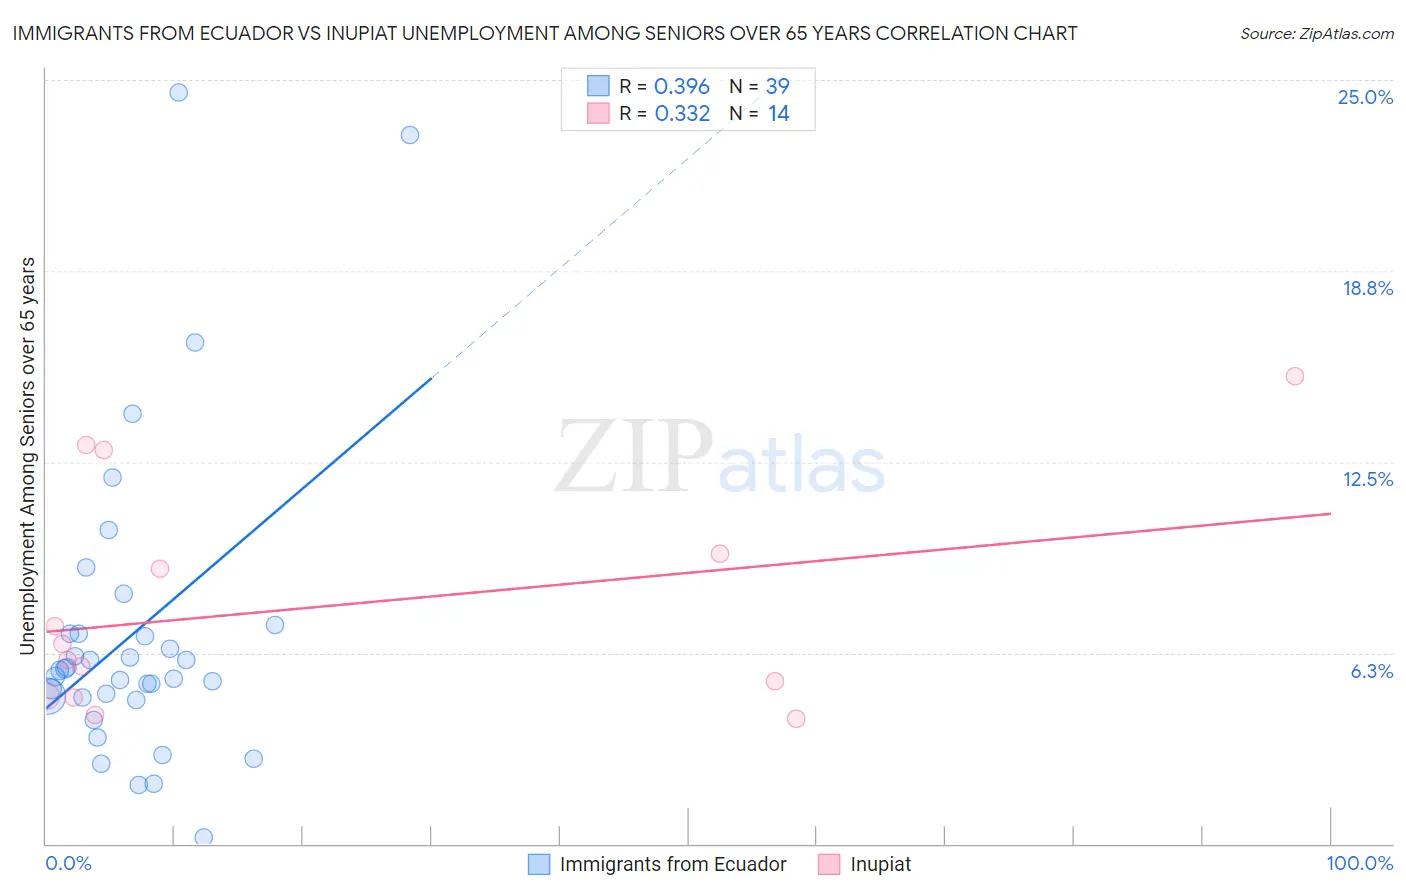
Immigrants from Ecuador vs Inupiat Unemployment Among Seniors over 65 years Correlation Chart
The statistical analysis conducted on geographies consisting of 254,673,342 people shows a mild positive correlation between the proportion of Immigrants from Ecuador and unemployment rate amomg seniors over the age of 65 in the United States with a correlation coefficient (R) of 0.396 and weighted average of 5.6%. Similarly, the statistical analysis conducted on geographies consisting of 92,385,648 people shows a mild positive correlation between the proportion of Inupiat and unemployment rate amomg seniors over the age of 65 in the United States with a correlation coefficient (R) of 0.332 and weighted average of 5.8%, a difference of 3.4%.
Unemployment Among Seniors over 65 years Correlation Summary
| Measurement | Immigrants from Ecuador | Inupiat |
| Minimum | 0.20% | 4.1% |
| Maximum | 24.6% | 15.3% |
| Range | 24.4% | 11.2% |
| Mean | 6.9% | 7.7% |
| Median | 5.7% | 6.3% |
| Interquartile 25% (IQ1) | 4.8% | 4.8% |
| Interquartile 75% (IQ3) | 6.9% | 9.5% |
| Interquartile Range (IQR) | 2.1% | 4.7% |
| Standard Deviation (Sample) | 5.1% | 3.7% |
| Standard Deviation (Population) | 5.0% | 3.5% |
Demographics Similar to Immigrants from Ecuador and Inupiat by Unemployment Among Seniors over 65 years
In terms of unemployment among seniors over 65 years, the demographic groups most similar to Immigrants from Ecuador are Barbadian (5.6%, a difference of 0.030%), Immigrants from Guyana (5.6%, a difference of 0.14%), Salvadoran (5.6%, a difference of 0.27%), Immigrants from Guatemala (5.6%, a difference of 0.31%), and Immigrants from St. Vincent and the Grenadines (5.6%, a difference of 0.53%). Similarly, the demographic groups most similar to Inupiat are Shoshone (5.9%, a difference of 0.43%), Yuman (5.8%, a difference of 0.57%), Immigrants from Dominica (5.8%, a difference of 0.75%), Bermudan (5.9%, a difference of 0.91%), and Native/Alaskan (5.8%, a difference of 1.1%).
| Demographics | Rating | Rank | Unemployment Among Seniors over 65 years |
| Immigrants | St. Vincent and the Grenadines | 0.0 /100 | #308 | Tragic 5.6% |
| Immigrants | Guatemala | 0.0 /100 | #309 | Tragic 5.6% |
| Salvadorans | 0.0 /100 | #310 | Tragic 5.6% |
| Immigrants | Guyana | 0.0 /100 | #311 | Tragic 5.6% |
| Immigrants | Ecuador | 0.0 /100 | #312 | Tragic 5.6% |
| Barbadians | 0.0 /100 | #313 | Tragic 5.6% |
| Delaware | 0.0 /100 | #314 | Tragic 5.7% |
| Immigrants | El Salvador | 0.0 /100 | #315 | Tragic 5.7% |
| Immigrants | Central America | 0.0 /100 | #316 | Tragic 5.7% |
| Immigrants | Bahamas | 0.0 /100 | #317 | Tragic 5.7% |
| Vietnamese | 0.0 /100 | #318 | Tragic 5.7% |
| Immigrants | Bangladesh | 0.0 /100 | #319 | Tragic 5.7% |
| Immigrants | Mexico | 0.0 /100 | #320 | Tragic 5.7% |
| British West Indians | 0.0 /100 | #321 | Tragic 5.8% |
| Natives/Alaskans | 0.0 /100 | #322 | Tragic 5.8% |
| Immigrants | Dominica | 0.0 /100 | #323 | Tragic 5.8% |
| Yuman | 0.0 /100 | #324 | Tragic 5.8% |
| Inupiat | 0.0 /100 | #325 | Tragic 5.8% |
| Shoshone | 0.0 /100 | #326 | Tragic 5.9% |
| Bermudans | 0.0 /100 | #327 | Tragic 5.9% |
| Puerto Ricans | 0.0 /100 | #328 | Tragic 5.9% |