Immigrants from Ecuador vs Immigrants from Dominican Republic Currently Married
COMPARE
Immigrants from Ecuador
Immigrants from Dominican Republic
Currently Married
Currently Married Comparison
Immigrants from Ecuador
Immigrants from Dominican Republic
43.2%
CURRENTLY MARRIED
0.0/ 100
METRIC RATING
282nd/ 347
METRIC RANK
38.9%
CURRENTLY MARRIED
0.0/ 100
METRIC RATING
342nd/ 347
METRIC RANK
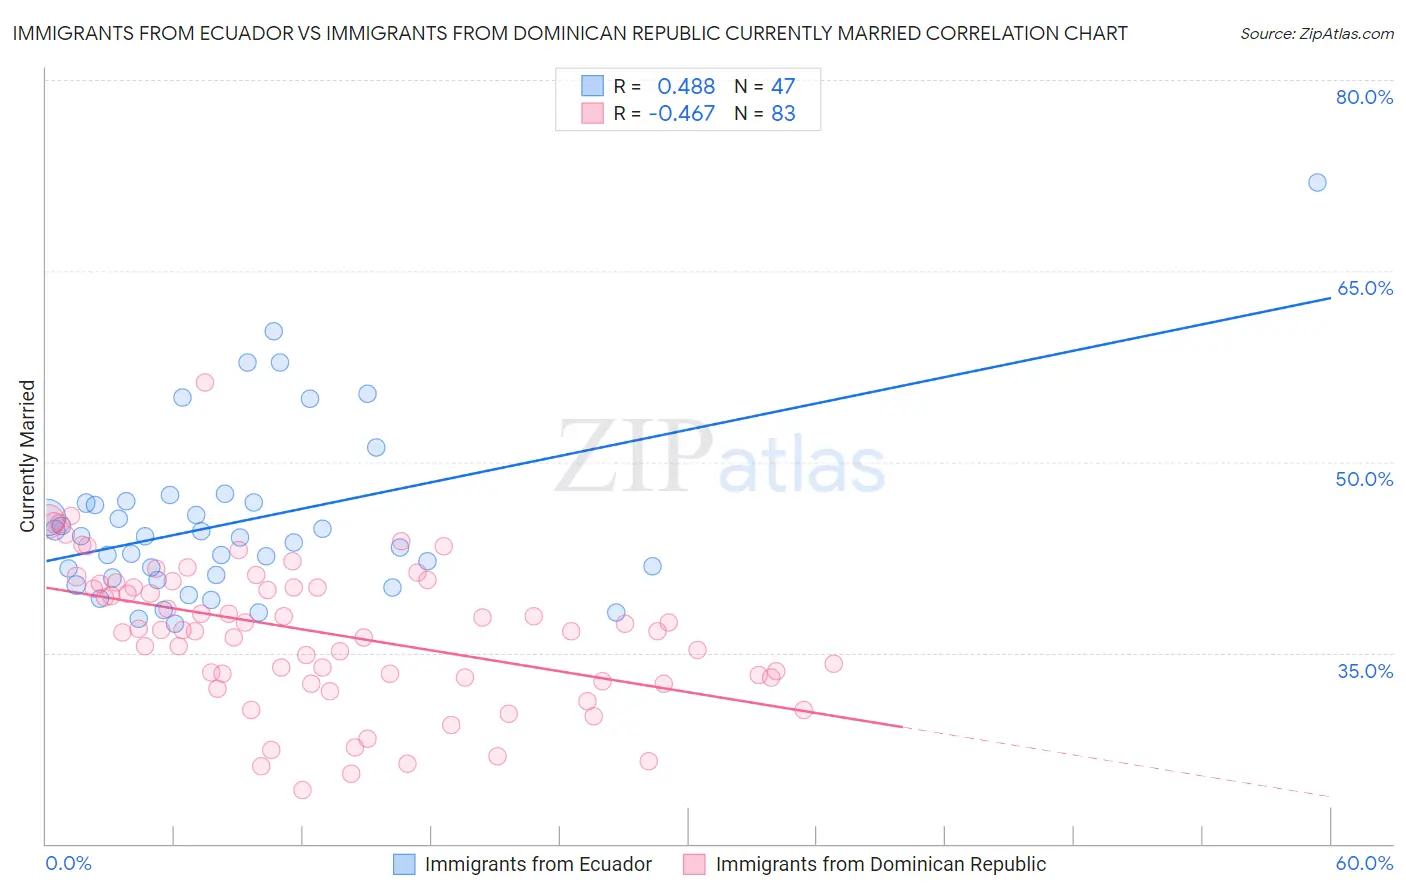
Immigrants from Ecuador vs Immigrants from Dominican Republic Currently Married Correlation Chart
The statistical analysis conducted on geographies consisting of 270,997,790 people shows a moderate positive correlation between the proportion of Immigrants from Ecuador and percentage of population currently married in the United States with a correlation coefficient (R) of 0.488 and weighted average of 43.2%. Similarly, the statistical analysis conducted on geographies consisting of 275,115,550 people shows a moderate negative correlation between the proportion of Immigrants from Dominican Republic and percentage of population currently married in the United States with a correlation coefficient (R) of -0.467 and weighted average of 38.9%, a difference of 11.0%.
Currently Married Correlation Summary
| Measurement | Immigrants from Ecuador | Immigrants from Dominican Republic |
| Minimum | 37.2% | 24.2% |
| Maximum | 71.9% | 56.2% |
| Range | 34.7% | 32.0% |
| Mean | 45.3% | 36.5% |
| Median | 44.1% | 36.8% |
| Interquartile 25% (IQ1) | 40.9% | 33.0% |
| Interquartile 75% (IQ3) | 46.8% | 40.5% |
| Interquartile Range (IQR) | 6.0% | 7.4% |
| Standard Deviation (Sample) | 6.9% | 5.7% |
| Standard Deviation (Population) | 6.8% | 5.7% |
Similar Demographics by Currently Married
Demographics Similar to Immigrants from Ecuador by Currently Married
In terms of currently married, the demographic groups most similar to Immigrants from Ecuador are Chippewa (43.2%, a difference of 0.070%), Apache (43.2%, a difference of 0.080%), Kiowa (43.2%, a difference of 0.11%), Immigrants from El Salvador (43.1%, a difference of 0.12%), and Central American Indian (43.3%, a difference of 0.16%).
| Demographics | Rating | Rank | Currently Married |
| Colville | 0.1 /100 | #275 | Tragic 43.4% |
| Sierra Leoneans | 0.1 /100 | #276 | Tragic 43.4% |
| Immigrants | Nigeria | 0.1 /100 | #277 | Tragic 43.4% |
| Central Americans | 0.0 /100 | #278 | Tragic 43.3% |
| Central American Indians | 0.0 /100 | #279 | Tragic 43.3% |
| Apache | 0.0 /100 | #280 | Tragic 43.2% |
| Chippewa | 0.0 /100 | #281 | Tragic 43.2% |
| Immigrants | Ecuador | 0.0 /100 | #282 | Tragic 43.2% |
| Kiowa | 0.0 /100 | #283 | Tragic 43.2% |
| Immigrants | El Salvador | 0.0 /100 | #284 | Tragic 43.1% |
| Immigrants | Middle Africa | 0.0 /100 | #285 | Tragic 43.0% |
| Ghanaians | 0.0 /100 | #286 | Tragic 42.9% |
| Guatemalans | 0.0 /100 | #287 | Tragic 42.9% |
| Natives/Alaskans | 0.0 /100 | #288 | Tragic 42.8% |
| Paiute | 0.0 /100 | #289 | Tragic 42.7% |
Demographics Similar to Immigrants from Dominican Republic by Currently Married
In terms of currently married, the demographic groups most similar to Immigrants from Dominican Republic are Navajo (39.0%, a difference of 0.17%), Immigrants from Grenada (39.1%, a difference of 0.52%), Dominican (39.5%, a difference of 1.5%), Cape Verdean (39.6%, a difference of 1.6%), and Black/African American (39.6%, a difference of 1.7%).
| Demographics | Rating | Rank | Currently Married |
| Yup'ik | 0.0 /100 | #333 | Tragic 39.9% |
| Puerto Ricans | 0.0 /100 | #334 | Tragic 39.9% |
| Lumbee | 0.0 /100 | #335 | Tragic 39.8% |
| British West Indians | 0.0 /100 | #336 | Tragic 39.8% |
| Blacks/African Americans | 0.0 /100 | #337 | Tragic 39.6% |
| Cape Verdeans | 0.0 /100 | #338 | Tragic 39.6% |
| Dominicans | 0.0 /100 | #339 | Tragic 39.5% |
| Immigrants | Grenada | 0.0 /100 | #340 | Tragic 39.1% |
| Navajo | 0.0 /100 | #341 | Tragic 39.0% |
| Immigrants | Dominican Republic | 0.0 /100 | #342 | Tragic 38.9% |
| Pueblo | 0.0 /100 | #343 | Tragic 38.2% |
| Immigrants | Cabo Verde | 0.0 /100 | #344 | Tragic 37.8% |
| Tohono O'odham | 0.0 /100 | #345 | Tragic 36.8% |
| Hopi | 0.0 /100 | #346 | Tragic 36.5% |
| Pima | 0.0 /100 | #347 | Tragic 35.9% |