Cuban vs Inupiat Currently Married
COMPARE
Cuban
Inupiat
Currently Married
Currently Married Comparison
Cubans
Inupiat
44.6%
CURRENTLY MARRIED
0.9/ 100
METRIC RATING
236th/ 347
METRIC RANK
41.3%
CURRENTLY MARRIED
0.0/ 100
METRIC RATING
315th/ 347
METRIC RANK
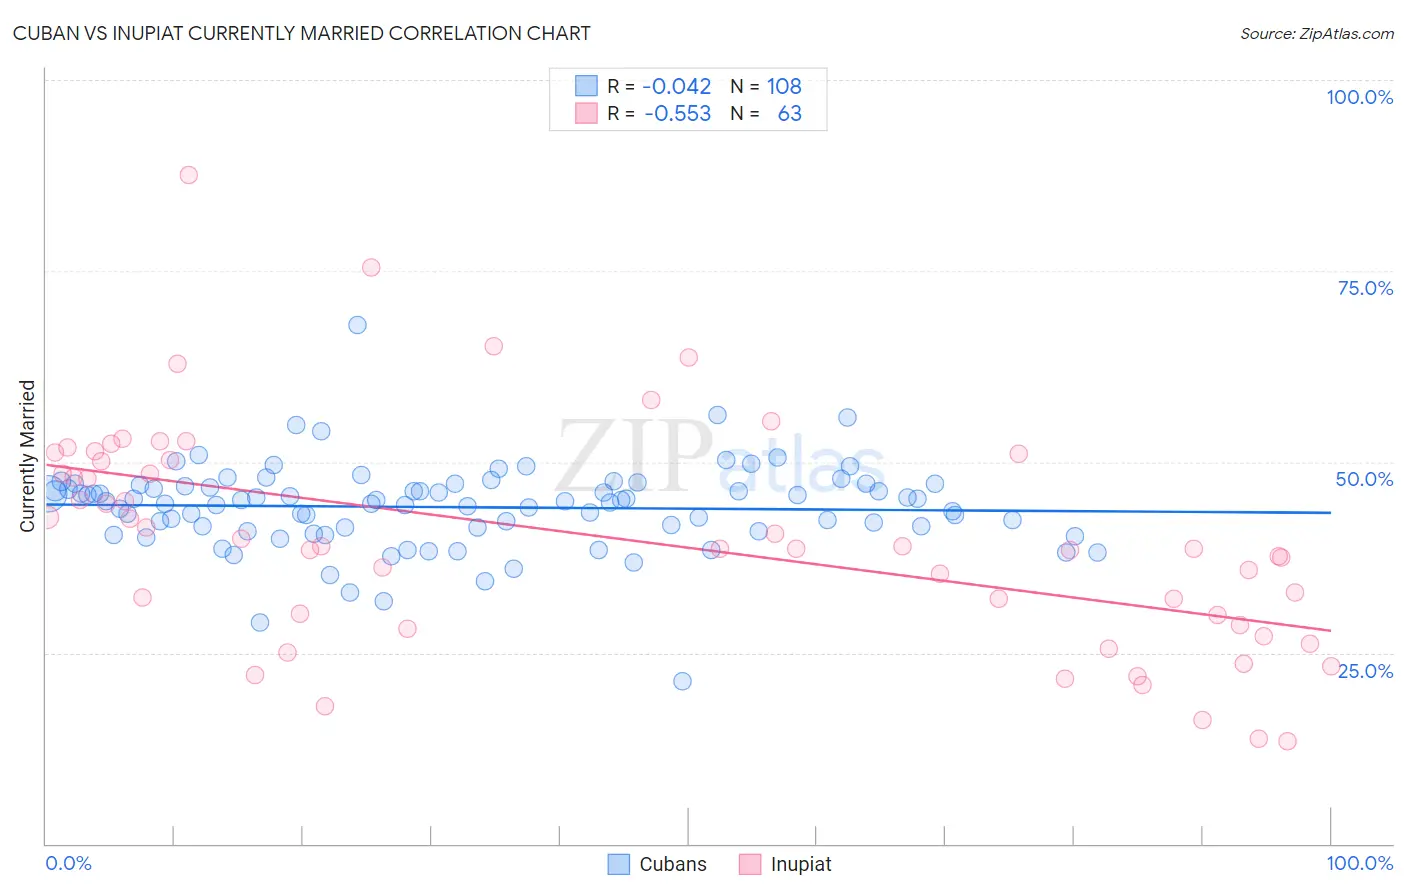
Cuban vs Inupiat Currently Married Correlation Chart
The statistical analysis conducted on geographies consisting of 449,312,568 people shows no correlation between the proportion of Cubans and percentage of population currently married in the United States with a correlation coefficient (R) of -0.042 and weighted average of 44.6%. Similarly, the statistical analysis conducted on geographies consisting of 96,349,193 people shows a substantial negative correlation between the proportion of Inupiat and percentage of population currently married in the United States with a correlation coefficient (R) of -0.553 and weighted average of 41.3%, a difference of 8.1%.
Currently Married Correlation Summary
| Measurement | Cuban | Inupiat |
| Minimum | 21.3% | 13.5% |
| Maximum | 67.9% | 87.5% |
| Range | 46.6% | 74.0% |
| Mean | 44.1% | 40.0% |
| Median | 44.8% | 38.7% |
| Interquartile 25% (IQ1) | 41.4% | 28.7% |
| Interquartile 75% (IQ3) | 46.9% | 50.3% |
| Interquartile Range (IQR) | 5.4% | 21.6% |
| Standard Deviation (Sample) | 5.7% | 14.7% |
| Standard Deviation (Population) | 5.6% | 14.6% |
Similar Demographics by Currently Married
Demographics Similar to Cubans by Currently Married
In terms of currently married, the demographic groups most similar to Cubans are Seminole (44.6%, a difference of 0.0%), Alaskan Athabascan (44.6%, a difference of 0.010%), Moroccan (44.6%, a difference of 0.080%), Iroquois (44.7%, a difference of 0.16%), and Immigrants from Saudi Arabia (44.7%, a difference of 0.17%).
| Demographics | Rating | Rank | Currently Married |
| Cree | 1.7 /100 | #229 | Tragic 44.9% |
| Immigrants | Kenya | 1.6 /100 | #230 | Tragic 44.9% |
| Immigrants | Panama | 1.5 /100 | #231 | Tragic 44.9% |
| Nepalese | 1.2 /100 | #232 | Tragic 44.7% |
| Immigrants | Saudi Arabia | 1.1 /100 | #233 | Tragic 44.7% |
| Iroquois | 1.1 /100 | #234 | Tragic 44.7% |
| Alaskan Athabascans | 0.9 /100 | #235 | Tragic 44.6% |
| Cubans | 0.9 /100 | #236 | Tragic 44.6% |
| Seminole | 0.9 /100 | #237 | Tragic 44.6% |
| Moroccans | 0.9 /100 | #238 | Tragic 44.6% |
| Immigrants | Mexico | 0.7 /100 | #239 | Tragic 44.5% |
| Mexican American Indians | 0.7 /100 | #240 | Tragic 44.5% |
| Ethiopians | 0.7 /100 | #241 | Tragic 44.5% |
| Immigrants | Cambodia | 0.7 /100 | #242 | Tragic 44.5% |
| Immigrants | Ethiopia | 0.7 /100 | #243 | Tragic 44.5% |
Demographics Similar to Inupiat by Currently Married
In terms of currently married, the demographic groups most similar to Inupiat are Immigrants from Caribbean (41.3%, a difference of 0.060%), Haitian (41.3%, a difference of 0.080%), West Indian (41.3%, a difference of 0.090%), Jamaican (41.4%, a difference of 0.16%), and Bahamian (41.2%, a difference of 0.26%).
| Demographics | Rating | Rank | Currently Married |
| Immigrants | Belize | 0.0 /100 | #308 | Tragic 41.8% |
| Immigrants | Liberia | 0.0 /100 | #309 | Tragic 41.8% |
| Guyanese | 0.0 /100 | #310 | Tragic 41.6% |
| Trinidadians and Tobagonians | 0.0 /100 | #311 | Tragic 41.5% |
| Somalis | 0.0 /100 | #312 | Tragic 41.5% |
| Jamaicans | 0.0 /100 | #313 | Tragic 41.4% |
| West Indians | 0.0 /100 | #314 | Tragic 41.3% |
| Inupiat | 0.0 /100 | #315 | Tragic 41.3% |
| Immigrants | Caribbean | 0.0 /100 | #316 | Tragic 41.3% |
| Haitians | 0.0 /100 | #317 | Tragic 41.3% |
| Bahamians | 0.0 /100 | #318 | Tragic 41.2% |
| Immigrants | Somalia | 0.0 /100 | #319 | Tragic 41.2% |
| Immigrants | Jamaica | 0.0 /100 | #320 | Tragic 41.1% |
| Immigrants | Congo | 0.0 /100 | #321 | Tragic 41.1% |
| Immigrants | Haiti | 0.0 /100 | #322 | Tragic 41.0% |