Immigrants from Ecuador vs Immigrants from Hong Kong Currently Married
COMPARE
Immigrants from Ecuador
Immigrants from Hong Kong
Currently Married
Currently Married Comparison
Immigrants from Ecuador
Immigrants from Hong Kong
43.2%
CURRENTLY MARRIED
0.0/ 100
METRIC RATING
282nd/ 347
METRIC RANK
48.9%
CURRENTLY MARRIED
99.5/ 100
METRIC RATING
32nd/ 347
METRIC RANK
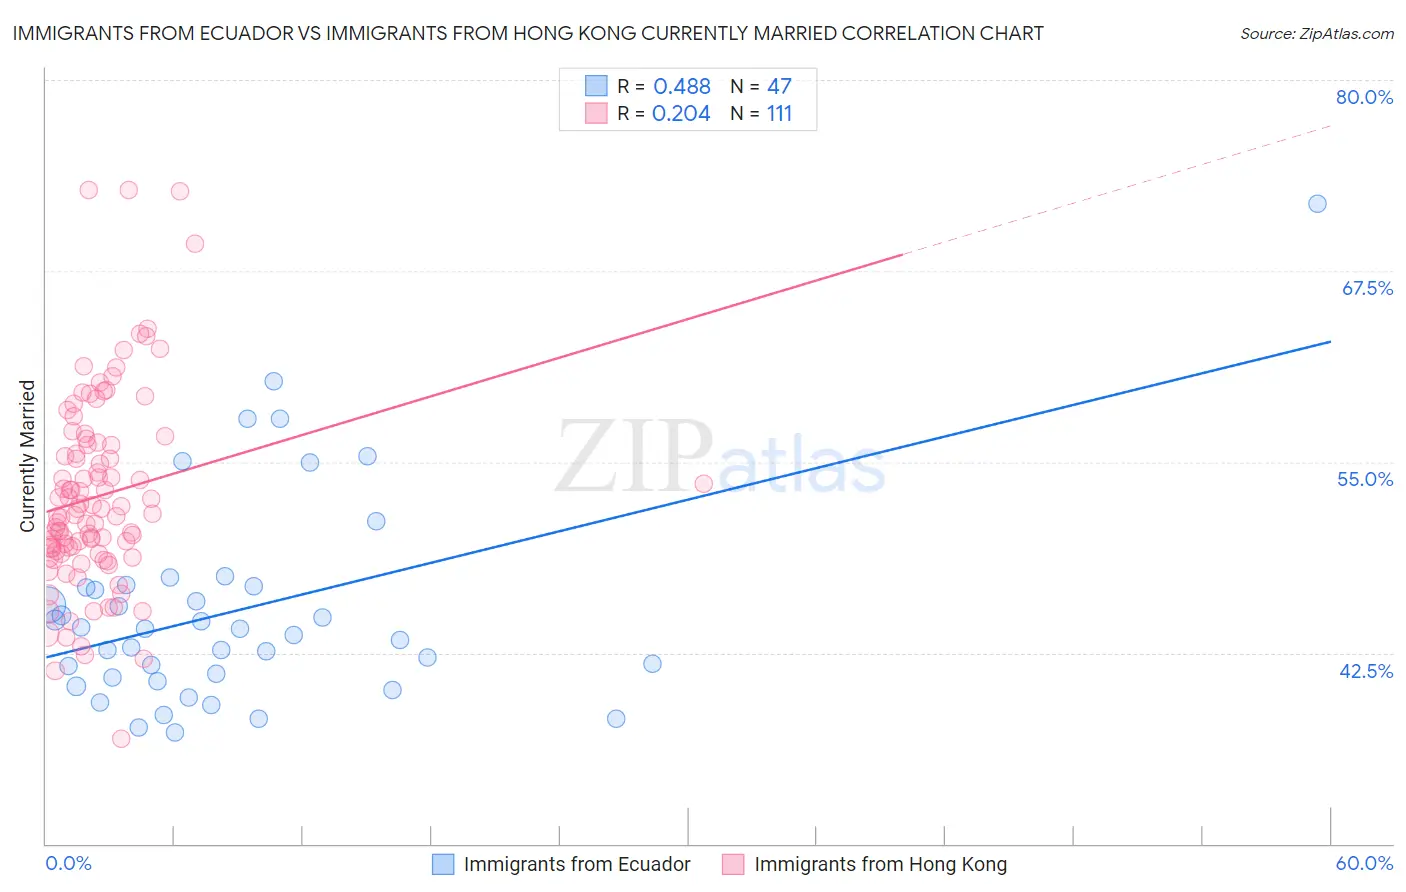
Immigrants from Ecuador vs Immigrants from Hong Kong Currently Married Correlation Chart
The statistical analysis conducted on geographies consisting of 270,997,790 people shows a moderate positive correlation between the proportion of Immigrants from Ecuador and percentage of population currently married in the United States with a correlation coefficient (R) of 0.488 and weighted average of 43.2%. Similarly, the statistical analysis conducted on geographies consisting of 253,978,076 people shows a weak positive correlation between the proportion of Immigrants from Hong Kong and percentage of population currently married in the United States with a correlation coefficient (R) of 0.204 and weighted average of 48.9%, a difference of 13.2%.
Currently Married Correlation Summary
| Measurement | Immigrants from Ecuador | Immigrants from Hong Kong |
| Minimum | 37.2% | 36.9% |
| Maximum | 71.9% | 72.8% |
| Range | 34.7% | 35.9% |
| Mean | 45.3% | 52.7% |
| Median | 44.1% | 51.5% |
| Interquartile 25% (IQ1) | 40.9% | 49.0% |
| Interquartile 75% (IQ3) | 46.8% | 56.1% |
| Interquartile Range (IQR) | 6.0% | 7.1% |
| Standard Deviation (Sample) | 6.9% | 6.4% |
| Standard Deviation (Population) | 6.8% | 6.4% |
Similar Demographics by Currently Married
Demographics Similar to Immigrants from Ecuador by Currently Married
In terms of currently married, the demographic groups most similar to Immigrants from Ecuador are Chippewa (43.2%, a difference of 0.070%), Apache (43.2%, a difference of 0.080%), Kiowa (43.2%, a difference of 0.11%), Immigrants from El Salvador (43.1%, a difference of 0.12%), and Central American Indian (43.3%, a difference of 0.16%).
| Demographics | Rating | Rank | Currently Married |
| Colville | 0.1 /100 | #275 | Tragic 43.4% |
| Sierra Leoneans | 0.1 /100 | #276 | Tragic 43.4% |
| Immigrants | Nigeria | 0.1 /100 | #277 | Tragic 43.4% |
| Central Americans | 0.0 /100 | #278 | Tragic 43.3% |
| Central American Indians | 0.0 /100 | #279 | Tragic 43.3% |
| Apache | 0.0 /100 | #280 | Tragic 43.2% |
| Chippewa | 0.0 /100 | #281 | Tragic 43.2% |
| Immigrants | Ecuador | 0.0 /100 | #282 | Tragic 43.2% |
| Kiowa | 0.0 /100 | #283 | Tragic 43.2% |
| Immigrants | El Salvador | 0.0 /100 | #284 | Tragic 43.1% |
| Immigrants | Middle Africa | 0.0 /100 | #285 | Tragic 43.0% |
| Ghanaians | 0.0 /100 | #286 | Tragic 42.9% |
| Guatemalans | 0.0 /100 | #287 | Tragic 42.9% |
| Natives/Alaskans | 0.0 /100 | #288 | Tragic 42.8% |
| Paiute | 0.0 /100 | #289 | Tragic 42.7% |
Demographics Similar to Immigrants from Hong Kong by Currently Married
In terms of currently married, the demographic groups most similar to Immigrants from Hong Kong are Eastern European (48.9%, a difference of 0.010%), Polish (48.9%, a difference of 0.010%), Croatian (48.9%, a difference of 0.020%), Irish (48.9%, a difference of 0.040%), and Welsh (48.9%, a difference of 0.070%).
| Demographics | Rating | Rank | Currently Married |
| Maltese | 99.6 /100 | #25 | Exceptional 49.0% |
| Immigrants | Korea | 99.6 /100 | #26 | Exceptional 49.0% |
| Burmese | 99.6 /100 | #27 | Exceptional 48.9% |
| Welsh | 99.5 /100 | #28 | Exceptional 48.9% |
| Croatians | 99.5 /100 | #29 | Exceptional 48.9% |
| Eastern Europeans | 99.5 /100 | #30 | Exceptional 48.9% |
| Poles | 99.5 /100 | #31 | Exceptional 48.9% |
| Immigrants | Hong Kong | 99.5 /100 | #32 | Exceptional 48.9% |
| Irish | 99.5 /100 | #33 | Exceptional 48.9% |
| Immigrants | Lithuania | 99.4 /100 | #34 | Exceptional 48.8% |
| Immigrants | Northern Europe | 99.4 /100 | #35 | Exceptional 48.8% |
| Italians | 99.4 /100 | #36 | Exceptional 48.8% |
| Hungarians | 99.4 /100 | #37 | Exceptional 48.8% |
| Czechoslovakians | 99.4 /100 | #38 | Exceptional 48.8% |
| British | 99.4 /100 | #39 | Exceptional 48.8% |