Kenyan vs Inupiat Currently Married
COMPARE
Kenyan
Inupiat
Currently Married
Currently Married Comparison
Kenyans
Inupiat
45.2%
CURRENTLY MARRIED
3.1/ 100
METRIC RATING
220th/ 347
METRIC RANK
41.3%
CURRENTLY MARRIED
0.0/ 100
METRIC RATING
315th/ 347
METRIC RANK
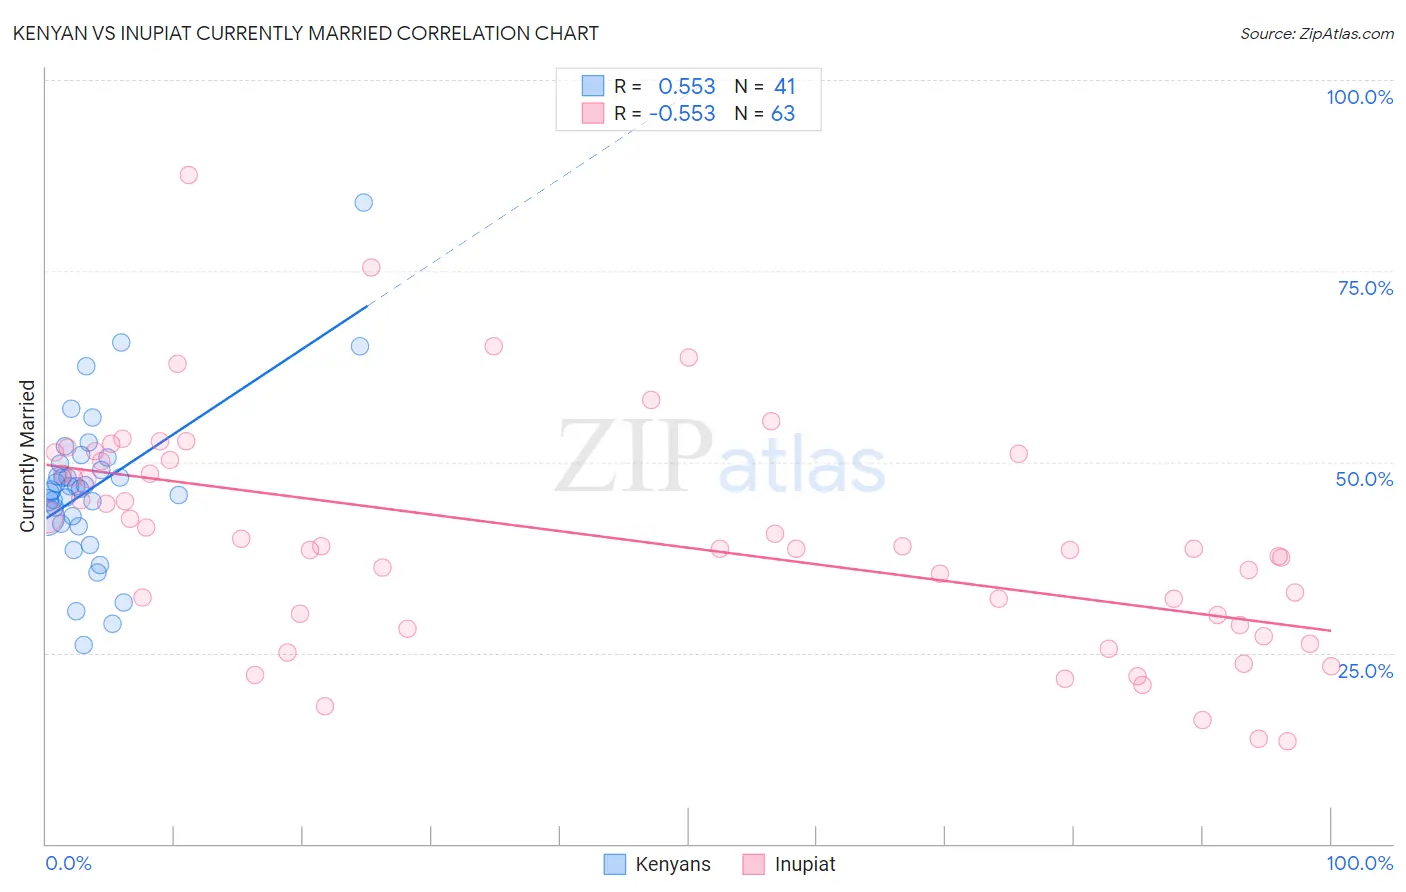
Kenyan vs Inupiat Currently Married Correlation Chart
The statistical analysis conducted on geographies consisting of 168,238,911 people shows a substantial positive correlation between the proportion of Kenyans and percentage of population currently married in the United States with a correlation coefficient (R) of 0.553 and weighted average of 45.2%. Similarly, the statistical analysis conducted on geographies consisting of 96,349,193 people shows a substantial negative correlation between the proportion of Inupiat and percentage of population currently married in the United States with a correlation coefficient (R) of -0.553 and weighted average of 41.3%, a difference of 9.4%.
Currently Married Correlation Summary
| Measurement | Kenyan | Inupiat |
| Minimum | 26.0% | 13.5% |
| Maximum | 83.9% | 87.5% |
| Range | 57.9% | 74.0% |
| Mean | 46.8% | 40.0% |
| Median | 46.5% | 38.7% |
| Interquartile 25% (IQ1) | 42.3% | 28.7% |
| Interquartile 75% (IQ3) | 50.1% | 50.3% |
| Interquartile Range (IQR) | 7.8% | 21.6% |
| Standard Deviation (Sample) | 10.4% | 14.7% |
| Standard Deviation (Population) | 10.3% | 14.6% |
Similar Demographics by Currently Married
Demographics Similar to Kenyans by Currently Married
In terms of currently married, the demographic groups most similar to Kenyans are Mexican (45.2%, a difference of 0.020%), Immigrants from Portugal (45.2%, a difference of 0.13%), Immigrants from the Azores (45.1%, a difference of 0.22%), Panamanian (45.3%, a difference of 0.24%), and Immigrants from Laos (45.0%, a difference of 0.30%).
| Demographics | Rating | Rank | Currently Married |
| Alaska Natives | 7.0 /100 | #213 | Tragic 45.5% |
| Dutch West Indians | 6.7 /100 | #214 | Tragic 45.5% |
| German Russians | 6.7 /100 | #215 | Tragic 45.5% |
| Immigrants | Morocco | 5.5 /100 | #216 | Tragic 45.4% |
| Immigrants | Thailand | 5.1 /100 | #217 | Tragic 45.4% |
| Panamanians | 4.0 /100 | #218 | Tragic 45.3% |
| Immigrants | Portugal | 3.5 /100 | #219 | Tragic 45.2% |
| Kenyans | 3.1 /100 | #220 | Tragic 45.2% |
| Mexicans | 3.0 /100 | #221 | Tragic 45.2% |
| Immigrants | Azores | 2.5 /100 | #222 | Tragic 45.1% |
| Immigrants | Laos | 2.3 /100 | #223 | Tragic 45.0% |
| Immigrants | Uganda | 2.2 /100 | #224 | Tragic 45.0% |
| French American Indians | 2.2 /100 | #225 | Tragic 45.0% |
| Comanche | 2.1 /100 | #226 | Tragic 45.0% |
| Spanish Americans | 2.1 /100 | #227 | Tragic 45.0% |
Demographics Similar to Inupiat by Currently Married
In terms of currently married, the demographic groups most similar to Inupiat are Immigrants from Caribbean (41.3%, a difference of 0.060%), Haitian (41.3%, a difference of 0.080%), West Indian (41.3%, a difference of 0.090%), Jamaican (41.4%, a difference of 0.16%), and Bahamian (41.2%, a difference of 0.26%).
| Demographics | Rating | Rank | Currently Married |
| Immigrants | Belize | 0.0 /100 | #308 | Tragic 41.8% |
| Immigrants | Liberia | 0.0 /100 | #309 | Tragic 41.8% |
| Guyanese | 0.0 /100 | #310 | Tragic 41.6% |
| Trinidadians and Tobagonians | 0.0 /100 | #311 | Tragic 41.5% |
| Somalis | 0.0 /100 | #312 | Tragic 41.5% |
| Jamaicans | 0.0 /100 | #313 | Tragic 41.4% |
| West Indians | 0.0 /100 | #314 | Tragic 41.3% |
| Inupiat | 0.0 /100 | #315 | Tragic 41.3% |
| Immigrants | Caribbean | 0.0 /100 | #316 | Tragic 41.3% |
| Haitians | 0.0 /100 | #317 | Tragic 41.3% |
| Bahamians | 0.0 /100 | #318 | Tragic 41.2% |
| Immigrants | Somalia | 0.0 /100 | #319 | Tragic 41.2% |
| Immigrants | Jamaica | 0.0 /100 | #320 | Tragic 41.1% |
| Immigrants | Congo | 0.0 /100 | #321 | Tragic 41.1% |
| Immigrants | Haiti | 0.0 /100 | #322 | Tragic 41.0% |