Immigrants from Ecuador vs Aleut Currently Married
COMPARE
Immigrants from Ecuador
Aleut
Currently Married
Currently Married Comparison
Immigrants from Ecuador
Aleuts
43.2%
CURRENTLY MARRIED
0.0/ 100
METRIC RATING
282nd/ 347
METRIC RANK
46.7%
CURRENTLY MARRIED
52.0/ 100
METRIC RATING
172nd/ 347
METRIC RANK
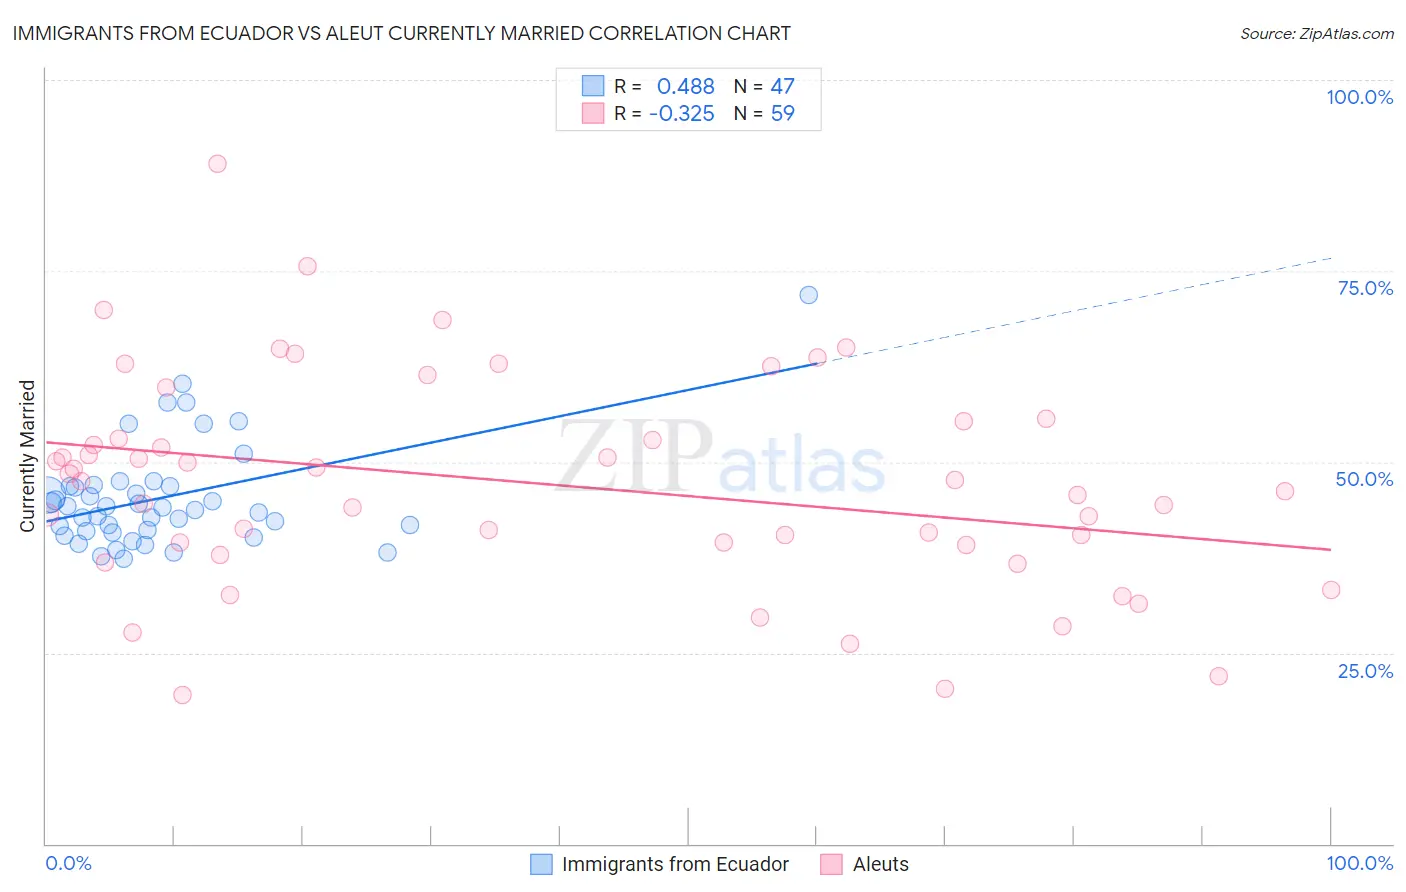
Immigrants from Ecuador vs Aleut Currently Married Correlation Chart
The statistical analysis conducted on geographies consisting of 270,997,790 people shows a moderate positive correlation between the proportion of Immigrants from Ecuador and percentage of population currently married in the United States with a correlation coefficient (R) of 0.488 and weighted average of 43.2%. Similarly, the statistical analysis conducted on geographies consisting of 61,778,471 people shows a mild negative correlation between the proportion of Aleuts and percentage of population currently married in the United States with a correlation coefficient (R) of -0.325 and weighted average of 46.7%, a difference of 8.0%.
Currently Married Correlation Summary
| Measurement | Immigrants from Ecuador | Aleut |
| Minimum | 37.2% | 19.5% |
| Maximum | 71.9% | 89.1% |
| Range | 34.7% | 69.6% |
| Mean | 45.3% | 47.2% |
| Median | 44.1% | 47.4% |
| Interquartile 25% (IQ1) | 40.9% | 39.1% |
| Interquartile 75% (IQ3) | 46.8% | 55.3% |
| Interquartile Range (IQR) | 6.0% | 16.2% |
| Standard Deviation (Sample) | 6.9% | 14.0% |
| Standard Deviation (Population) | 6.8% | 13.9% |
Similar Demographics by Currently Married
Demographics Similar to Immigrants from Ecuador by Currently Married
In terms of currently married, the demographic groups most similar to Immigrants from Ecuador are Chippewa (43.2%, a difference of 0.070%), Apache (43.2%, a difference of 0.080%), Kiowa (43.2%, a difference of 0.11%), Immigrants from El Salvador (43.1%, a difference of 0.12%), and Central American Indian (43.3%, a difference of 0.16%).
| Demographics | Rating | Rank | Currently Married |
| Colville | 0.1 /100 | #275 | Tragic 43.4% |
| Sierra Leoneans | 0.1 /100 | #276 | Tragic 43.4% |
| Immigrants | Nigeria | 0.1 /100 | #277 | Tragic 43.4% |
| Central Americans | 0.0 /100 | #278 | Tragic 43.3% |
| Central American Indians | 0.0 /100 | #279 | Tragic 43.3% |
| Apache | 0.0 /100 | #280 | Tragic 43.2% |
| Chippewa | 0.0 /100 | #281 | Tragic 43.2% |
| Immigrants | Ecuador | 0.0 /100 | #282 | Tragic 43.2% |
| Kiowa | 0.0 /100 | #283 | Tragic 43.2% |
| Immigrants | El Salvador | 0.0 /100 | #284 | Tragic 43.1% |
| Immigrants | Middle Africa | 0.0 /100 | #285 | Tragic 43.0% |
| Ghanaians | 0.0 /100 | #286 | Tragic 42.9% |
| Guatemalans | 0.0 /100 | #287 | Tragic 42.9% |
| Natives/Alaskans | 0.0 /100 | #288 | Tragic 42.8% |
| Paiute | 0.0 /100 | #289 | Tragic 42.7% |
Demographics Similar to Aleuts by Currently Married
In terms of currently married, the demographic groups most similar to Aleuts are Immigrants from Zimbabwe (46.7%, a difference of 0.010%), Tlingit-Haida (46.7%, a difference of 0.030%), Peruvian (46.6%, a difference of 0.070%), Immigrants from Brazil (46.6%, a difference of 0.080%), and Hawaiian (46.6%, a difference of 0.13%).
| Demographics | Rating | Rank | Currently Married |
| Samoans | 59.8 /100 | #165 | Average 46.8% |
| Immigrants | Syria | 59.3 /100 | #166 | Average 46.8% |
| Spaniards | 58.8 /100 | #167 | Average 46.8% |
| Immigrants | Afghanistan | 58.2 /100 | #168 | Average 46.8% |
| Armenians | 58.2 /100 | #169 | Average 46.8% |
| Immigrants | Latvia | 56.7 /100 | #170 | Average 46.7% |
| Immigrants | Zimbabwe | 52.4 /100 | #171 | Average 46.7% |
| Aleuts | 52.0 /100 | #172 | Average 46.7% |
| Tlingit-Haida | 51.2 /100 | #173 | Average 46.7% |
| Peruvians | 50.0 /100 | #174 | Average 46.6% |
| Immigrants | Brazil | 49.9 /100 | #175 | Average 46.6% |
| Hawaiians | 48.6 /100 | #176 | Average 46.6% |
| Israelis | 48.6 /100 | #177 | Average 46.6% |
| Chickasaw | 47.8 /100 | #178 | Average 46.6% |
| Immigrants | Oceania | 44.6 /100 | #179 | Average 46.5% |