Japanese vs Aleut Currently Married
COMPARE
Japanese
Aleut
Currently Married
Currently Married Comparison
Japanese
Aleuts
44.5%
CURRENTLY MARRIED
0.6/ 100
METRIC RATING
244th/ 347
METRIC RANK
46.7%
CURRENTLY MARRIED
52.0/ 100
METRIC RATING
172nd/ 347
METRIC RANK
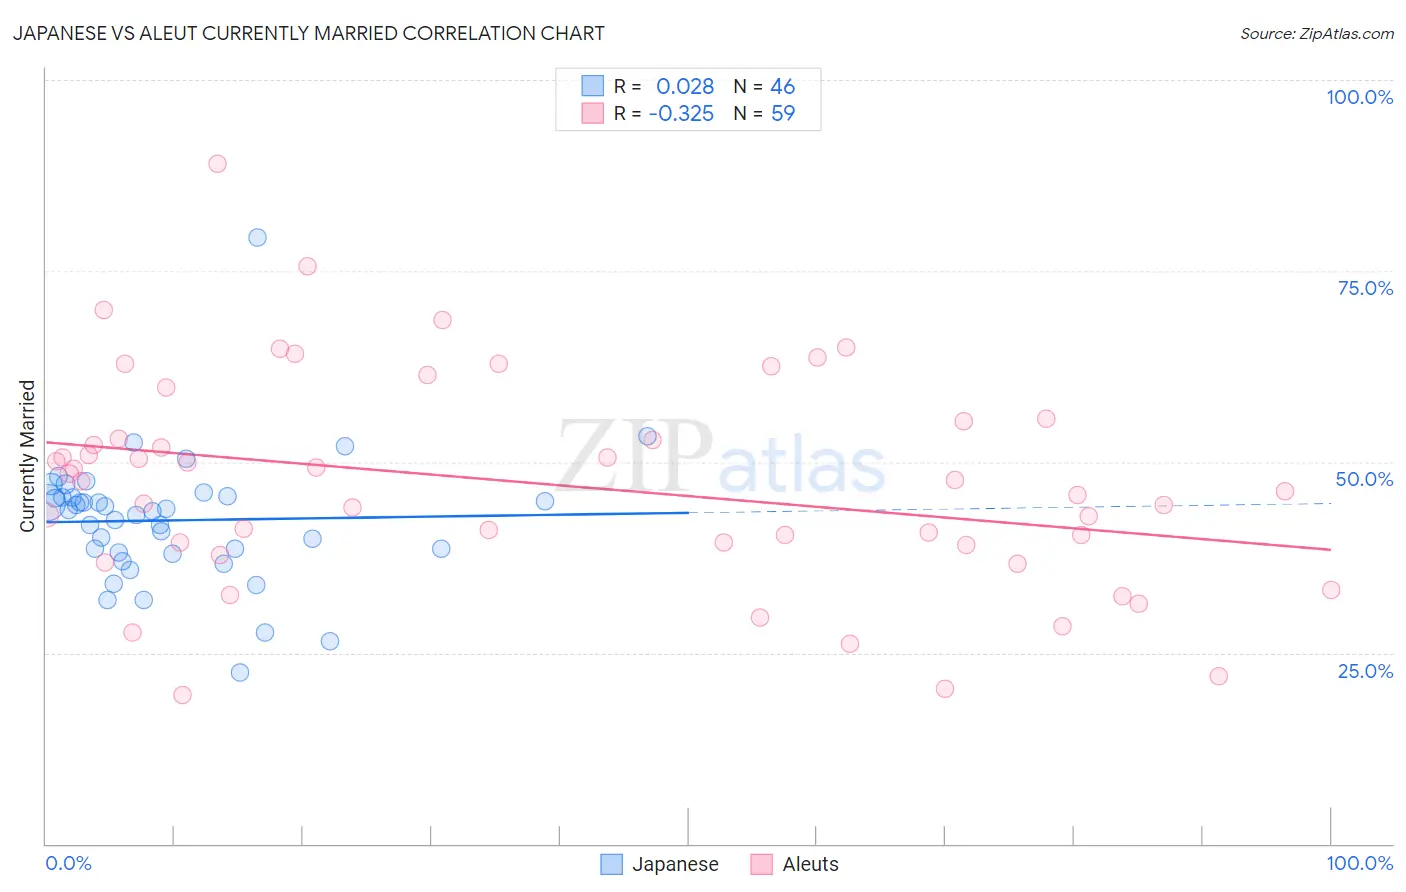
Japanese vs Aleut Currently Married Correlation Chart
The statistical analysis conducted on geographies consisting of 249,168,550 people shows no correlation between the proportion of Japanese and percentage of population currently married in the United States with a correlation coefficient (R) of 0.028 and weighted average of 44.5%. Similarly, the statistical analysis conducted on geographies consisting of 61,778,471 people shows a mild negative correlation between the proportion of Aleuts and percentage of population currently married in the United States with a correlation coefficient (R) of -0.325 and weighted average of 46.7%, a difference of 5.0%.
Currently Married Correlation Summary
| Measurement | Japanese | Aleut |
| Minimum | 22.4% | 19.5% |
| Maximum | 79.3% | 89.1% |
| Range | 56.9% | 69.6% |
| Mean | 42.3% | 47.2% |
| Median | 43.7% | 47.4% |
| Interquartile 25% (IQ1) | 38.2% | 39.1% |
| Interquartile 75% (IQ3) | 45.4% | 55.3% |
| Interquartile Range (IQR) | 7.2% | 16.2% |
| Standard Deviation (Sample) | 8.6% | 14.0% |
| Standard Deviation (Population) | 8.6% | 13.9% |
Similar Demographics by Currently Married
Demographics Similar to Japanese by Currently Married
In terms of currently married, the demographic groups most similar to Japanese are Immigrants from Ethiopia (44.5%, a difference of 0.070%), Immigrants from Cambodia (44.5%, a difference of 0.090%), Ethiopian (44.5%, a difference of 0.12%), Immigrants from Mexico (44.5%, a difference of 0.18%), and Mexican American Indian (44.5%, a difference of 0.18%).
| Demographics | Rating | Rank | Currently Married |
| Seminole | 0.9 /100 | #237 | Tragic 44.6% |
| Moroccans | 0.9 /100 | #238 | Tragic 44.6% |
| Immigrants | Mexico | 0.7 /100 | #239 | Tragic 44.5% |
| Mexican American Indians | 0.7 /100 | #240 | Tragic 44.5% |
| Ethiopians | 0.7 /100 | #241 | Tragic 44.5% |
| Immigrants | Cambodia | 0.7 /100 | #242 | Tragic 44.5% |
| Immigrants | Ethiopia | 0.7 /100 | #243 | Tragic 44.5% |
| Japanese | 0.6 /100 | #244 | Tragic 44.5% |
| Immigrants | Armenia | 0.4 /100 | #245 | Tragic 44.3% |
| Immigrants | Burma/Myanmar | 0.4 /100 | #246 | Tragic 44.3% |
| Ugandans | 0.4 /100 | #247 | Tragic 44.2% |
| Nicaraguans | 0.3 /100 | #248 | Tragic 44.2% |
| Immigrants | Cameroon | 0.3 /100 | #249 | Tragic 44.2% |
| Immigrants | Eastern Africa | 0.3 /100 | #250 | Tragic 44.2% |
| Blackfeet | 0.3 /100 | #251 | Tragic 44.2% |
Demographics Similar to Aleuts by Currently Married
In terms of currently married, the demographic groups most similar to Aleuts are Immigrants from Zimbabwe (46.7%, a difference of 0.010%), Tlingit-Haida (46.7%, a difference of 0.030%), Peruvian (46.6%, a difference of 0.070%), Immigrants from Brazil (46.6%, a difference of 0.080%), and Hawaiian (46.6%, a difference of 0.13%).
| Demographics | Rating | Rank | Currently Married |
| Samoans | 59.8 /100 | #165 | Average 46.8% |
| Immigrants | Syria | 59.3 /100 | #166 | Average 46.8% |
| Spaniards | 58.8 /100 | #167 | Average 46.8% |
| Immigrants | Afghanistan | 58.2 /100 | #168 | Average 46.8% |
| Armenians | 58.2 /100 | #169 | Average 46.8% |
| Immigrants | Latvia | 56.7 /100 | #170 | Average 46.7% |
| Immigrants | Zimbabwe | 52.4 /100 | #171 | Average 46.7% |
| Aleuts | 52.0 /100 | #172 | Average 46.7% |
| Tlingit-Haida | 51.2 /100 | #173 | Average 46.7% |
| Peruvians | 50.0 /100 | #174 | Average 46.6% |
| Immigrants | Brazil | 49.9 /100 | #175 | Average 46.6% |
| Hawaiians | 48.6 /100 | #176 | Average 46.6% |
| Israelis | 48.6 /100 | #177 | Average 46.6% |
| Chickasaw | 47.8 /100 | #178 | Average 46.6% |
| Immigrants | Oceania | 44.6 /100 | #179 | Average 46.5% |