Immigrants from Romania vs Aleut Currently Married
COMPARE
Immigrants from Romania
Aleut
Currently Married
Currently Married Comparison
Immigrants from Romania
Aleuts
48.4%
CURRENTLY MARRIED
98.5/ 100
METRIC RATING
60th/ 347
METRIC RANK
46.7%
CURRENTLY MARRIED
52.0/ 100
METRIC RATING
172nd/ 347
METRIC RANK
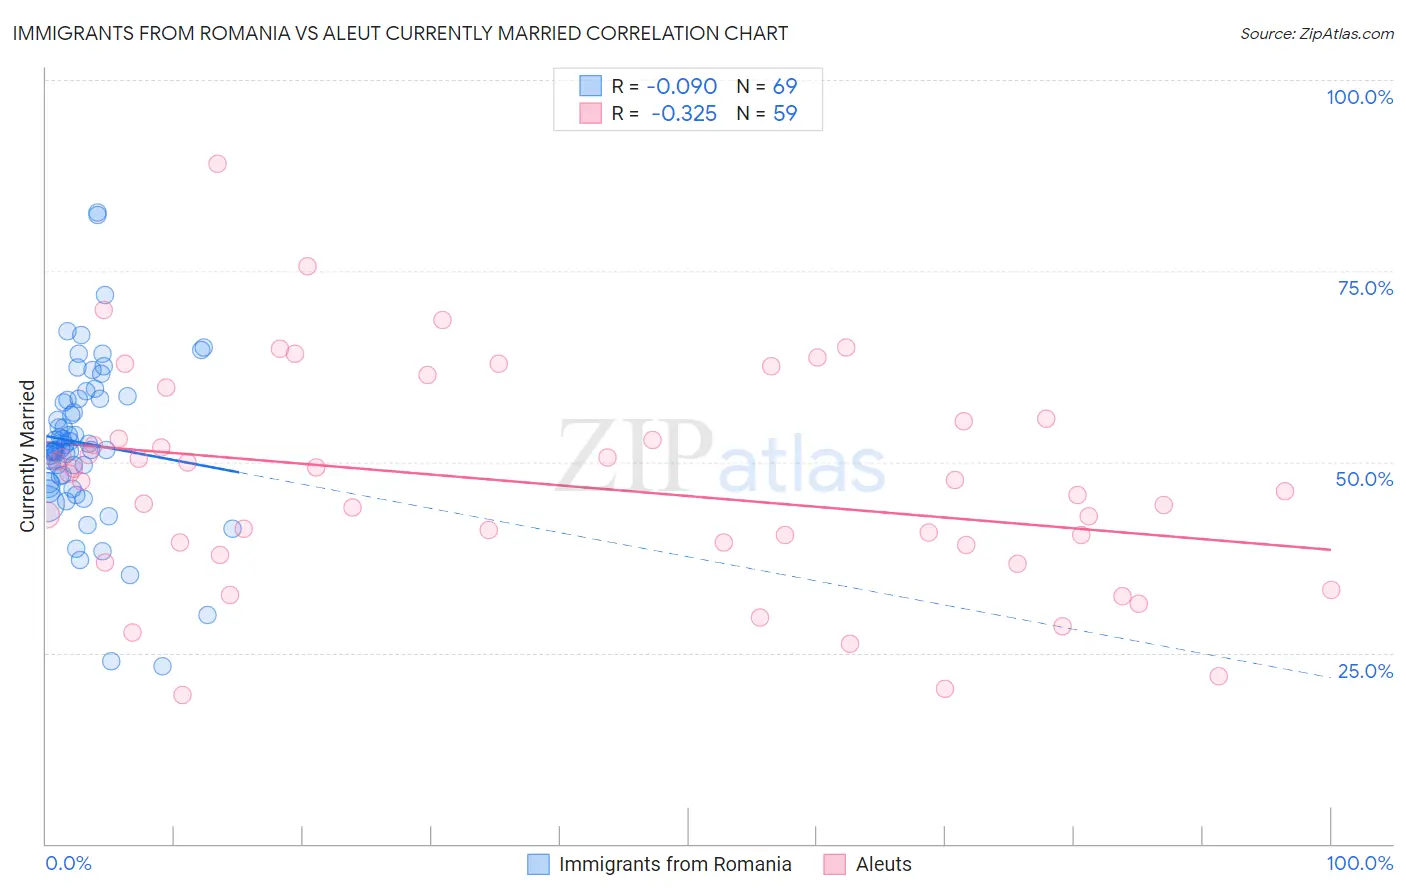
Immigrants from Romania vs Aleut Currently Married Correlation Chart
The statistical analysis conducted on geographies consisting of 257,009,333 people shows a slight negative correlation between the proportion of Immigrants from Romania and percentage of population currently married in the United States with a correlation coefficient (R) of -0.090 and weighted average of 48.4%. Similarly, the statistical analysis conducted on geographies consisting of 61,778,471 people shows a mild negative correlation between the proportion of Aleuts and percentage of population currently married in the United States with a correlation coefficient (R) of -0.325 and weighted average of 46.7%, a difference of 3.7%.
Currently Married Correlation Summary
| Measurement | Immigrants from Romania | Aleut |
| Minimum | 23.2% | 19.5% |
| Maximum | 82.6% | 89.1% |
| Range | 59.4% | 69.6% |
| Mean | 52.4% | 47.2% |
| Median | 51.6% | 47.4% |
| Interquartile 25% (IQ1) | 47.1% | 39.1% |
| Interquartile 75% (IQ3) | 58.3% | 55.3% |
| Interquartile Range (IQR) | 11.2% | 16.2% |
| Standard Deviation (Sample) | 10.7% | 14.0% |
| Standard Deviation (Population) | 10.6% | 13.9% |
Similar Demographics by Currently Married
Demographics Similar to Immigrants from Romania by Currently Married
In terms of currently married, the demographic groups most similar to Immigrants from Romania are Immigrants from Ireland (48.4%, a difference of 0.010%), Romanian (48.4%, a difference of 0.010%), Asian (48.4%, a difference of 0.010%), French (48.4%, a difference of 0.040%), and Immigrants from Netherlands (48.5%, a difference of 0.090%).
| Demographics | Rating | Rank | Currently Married |
| Immigrants | Austria | 98.8 /100 | #53 | Exceptional 48.5% |
| Immigrants | Moldova | 98.7 /100 | #54 | Exceptional 48.5% |
| Immigrants | North Macedonia | 98.7 /100 | #55 | Exceptional 48.5% |
| Latvians | 98.7 /100 | #56 | Exceptional 48.5% |
| Immigrants | Netherlands | 98.6 /100 | #57 | Exceptional 48.5% |
| French | 98.6 /100 | #58 | Exceptional 48.4% |
| Immigrants | Ireland | 98.5 /100 | #59 | Exceptional 48.4% |
| Immigrants | Romania | 98.5 /100 | #60 | Exceptional 48.4% |
| Romanians | 98.5 /100 | #61 | Exceptional 48.4% |
| Asians | 98.5 /100 | #62 | Exceptional 48.4% |
| Slavs | 98.3 /100 | #63 | Exceptional 48.4% |
| Immigrants | Czechoslovakia | 98.3 /100 | #64 | Exceptional 48.4% |
| Ukrainians | 98.3 /100 | #65 | Exceptional 48.4% |
| Tongans | 98.2 /100 | #66 | Exceptional 48.3% |
| Slovaks | 98.2 /100 | #67 | Exceptional 48.3% |
Demographics Similar to Aleuts by Currently Married
In terms of currently married, the demographic groups most similar to Aleuts are Immigrants from Zimbabwe (46.7%, a difference of 0.010%), Tlingit-Haida (46.7%, a difference of 0.030%), Peruvian (46.6%, a difference of 0.070%), Immigrants from Brazil (46.6%, a difference of 0.080%), and Hawaiian (46.6%, a difference of 0.13%).
| Demographics | Rating | Rank | Currently Married |
| Samoans | 59.8 /100 | #165 | Average 46.8% |
| Immigrants | Syria | 59.3 /100 | #166 | Average 46.8% |
| Spaniards | 58.8 /100 | #167 | Average 46.8% |
| Immigrants | Afghanistan | 58.2 /100 | #168 | Average 46.8% |
| Armenians | 58.2 /100 | #169 | Average 46.8% |
| Immigrants | Latvia | 56.7 /100 | #170 | Average 46.7% |
| Immigrants | Zimbabwe | 52.4 /100 | #171 | Average 46.7% |
| Aleuts | 52.0 /100 | #172 | Average 46.7% |
| Tlingit-Haida | 51.2 /100 | #173 | Average 46.7% |
| Peruvians | 50.0 /100 | #174 | Average 46.6% |
| Immigrants | Brazil | 49.9 /100 | #175 | Average 46.6% |
| Hawaiians | 48.6 /100 | #176 | Average 46.6% |
| Israelis | 48.6 /100 | #177 | Average 46.6% |
| Chickasaw | 47.8 /100 | #178 | Average 46.6% |
| Immigrants | Oceania | 44.6 /100 | #179 | Average 46.5% |