Immigrants from Eastern Africa vs Hopi Family Households

COMPARE

Immigrants from Eastern Africa
Race
Ancestry
AfghanAfricanAlaska NativeAlaskan AthabascanAlbanianAleutAlsatianAmericanApacheArabArapahoArgentineanArmenianAssyrian/Chaldean/SyriacAustralianAustrianBahamianBangladeshiBarbadianBasqueBelgianBelizeanBermudanBhutaneseBlackfeetBolivianBrazilianBritishBritish West IndianBulgarianBurmeseCajunCambodianCanadianCape VerdeanCarpatho RusynCelticCentral AmericanCentral American IndianCherokeeCheyenneChickasawChileanChineseChippewaChoctawColombianColvilleComancheCosta RicanCreeCreekCroatianCrowCubanCypriotCzechCzechoslovakianDanishDelawareDominicanDutchDutch West IndianEastern EuropeanEcuadorianEgyptianEnglishEstonianEthiopianEuropeanFijianFilipinoFinnishFrenchFrench American IndianFrench CanadianGermanGerman RussianGhanaianGreekGuamanian/ChamorroGuatemalanGuyaneseHaitianHmongHonduranHoumaHungarianIcelanderIndian (Asian)IndonesianInupiatIranianIraqiIrishIroquoisIsraeliItalianJamaicanJapaneseJordanianKenyanKiowaKoreanLaotianLatvianLebaneseLiberianLithuanianLumbeeLuxembourgerMacedonianMalaysianMalteseMarshalleseMenomineeMexicanMexican American IndianMongolianMoroccanNative HawaiianNavajoNepaleseNew ZealanderNicaraguanNigerianNorthern EuropeanNorwegianOkinawanOsageOttawaPaiutePakistaniPalestinianPanamanianParaguayanPennsylvania GermanPeruvianPimaPolishPortuguesePotawatomiPuebloPuerto RicanPuget Sound SalishRomanianRussianSalvadoranSamoanScandinavianScotch-IrishScottishSeminoleSenegaleseSerbianShoshoneSierra LeoneanSiouxSlavicSlovakSloveneSomaliSouth AfricanSouth AmericanSouth American IndianSoviet UnionSpaniardSpanishSpanish AmericanSpanish American IndianSri LankanSubsaharan AfricanSudaneseSwedishSwissSyrianTaiwaneseThaiTlingit-HaidaTohono O'OdhamTonganTrinidadian and TobagonianTsimshianTurkishU.S. Virgin IslanderUgandanUkrainianUruguayanUteVenezuelanVietnameseWelshWest IndianYakamaYaquiYugoslavianYumanYup'ikZimbabwean
Immigration
NonimmigrantsImmigrantsAfghanistanAfricaAlbaniaArgentinaArmeniaAsiaAustraliaAustriaBahamasBangladeshBarbadosBelarusBelgiumBelizeBoliviaBosnia and HerzegovinaBrazilBulgariaBurma/MyanmarCabo VerdeCambodiaCameroonCanadaCaribbeanCentral AmericaChileChinaColombiaCongoCosta RicaCroatiaCubaCzechoslovakiaDenmarkDominicaDominican RepublicEastern AfricaEastern AsiaEastern EuropeEcuadorEgyptEl SalvadorEnglandEritreaEthiopiaEuropeFijiFranceGermanyGhanaGreeceGrenadaGuatemalaGuyanaHaitiHondurasHong KongHungaryIndiaIndonesiaIranIraqIrelandIsraelItalyJamaicaJapanJordanKazakhstanKenyaKoreaKuwaitLaosLatin AmericaLatviaLebanonLiberiaLithuaniaMalaysiaMexicoMicronesiaMiddle AfricaMoldovaMoroccoNepalNetherlandsNicaraguaNigeriaNorth AmericaNorth MacedoniaNorthern AfricaNorthern EuropeNorwayOceaniaPakistanPanamaPeruPhilippinesPolandPortugalRomaniaRussiaSaudi ArabiaScotlandSenegalSerbiaSierra LeoneSingaporeSomaliaSouth AfricaSouth AmericaSouth Central AsiaSouth Eastern AsiaSouthern EuropeSpainSri LankaSt. Vincent and the GrenadinesSudanSwedenSwitzerlandSyriaTaiwanThailandTrinidad and TobagoTurkeyUgandaUkraineUruguayUzbekistanVenezuelaVietnamWest IndiesWestern AfricaWestern AsiaWestern EuropeYemenZaireZimbabweAzores
Hopi
Race
Ancestry
AfghanAfricanAlaska NativeAlaskan AthabascanAlbanianAleutAlsatianAmericanApacheArabArapahoArgentineanArmenianAssyrian/Chaldean/SyriacAustralianAustrianBahamianBangladeshiBarbadianBasqueBelgianBelizeanBermudanBhutaneseBlackfeetBolivianBrazilianBritishBritish West IndianBulgarianBurmeseCajunCambodianCanadianCape VerdeanCarpatho RusynCelticCentral AmericanCentral American IndianCherokeeCheyenneChickasawChileanChineseChippewaChoctawColombianColvilleComancheCosta RicanCreeCreekCroatianCrowCubanCypriotCzechCzechoslovakianDanishDelawareDominicanDutchDutch West IndianEastern EuropeanEcuadorianEgyptianEnglishEstonianEthiopianEuropeanFijianFilipinoFinnishFrenchFrench American IndianFrench CanadianGermanGerman RussianGhanaianGreekGuamanian/ChamorroGuatemalanGuyaneseHaitianHmongHonduranHopiHoumaHungarianIcelanderIndian (Asian)IndonesianInupiatIranianIraqiIrishIroquoisIsraeliItalianJamaicanJapaneseJordanianKenyanKiowaKoreanLaotianLatvianLebaneseLiberianLithuanianLumbeeLuxembourgerMacedonianMalaysianMalteseMarshalleseMenomineeMexicanMexican American IndianMongolianMoroccanNative HawaiianNavajoNepaleseNew ZealanderNicaraguanNigerianNorthern EuropeanNorwegianOkinawanOsageOttawaPaiutePakistaniPalestinianPanamanianParaguayanPennsylvania GermanPeruvianPimaPolishPortuguesePotawatomiPuebloPuerto RicanPuget Sound SalishRomanianRussianSalvadoranSamoanScandinavianScotch-IrishScottishSeminoleSenegaleseSerbianShoshoneSierra LeoneanSiouxSlavicSlovakSloveneSomaliSouth AfricanSouth AmericanSouth American IndianSoviet UnionSpaniardSpanishSpanish AmericanSpanish American IndianSri LankanSubsaharan AfricanSudaneseSwedishSwissSyrianTaiwaneseThaiTlingit-HaidaTohono O'OdhamTonganTrinidadian and TobagonianTsimshianTurkishU.S. Virgin IslanderUgandanUkrainianUruguayanUteVenezuelanVietnameseWelshWest IndianYakamaYaquiYugoslavianYumanYup'ikZimbabwean
Immigration
NonimmigrantsImmigrantsAfghanistanAfricaAlbaniaArgentinaArmeniaAsiaAustraliaAustriaBahamasBangladeshBarbadosBelarusBelgiumBelizeBoliviaBosnia and HerzegovinaBrazilBulgariaBurma/MyanmarCabo VerdeCambodiaCameroonCanadaCaribbeanCentral AmericaChileChinaColombiaCongoCosta RicaCroatiaCubaCzechoslovakiaDenmarkDominicaDominican RepublicEastern AsiaEastern EuropeEcuadorEgyptEl SalvadorEnglandEritreaEthiopiaEuropeFijiFranceGermanyGhanaGreeceGrenadaGuatemalaGuyanaHaitiHondurasHong KongHungaryIndiaIndonesiaIranIraqIrelandIsraelItalyJamaicaJapanJordanKazakhstanKenyaKoreaKuwaitLaosLatin AmericaLatviaLebanonLiberiaLithuaniaMalaysiaMexicoMicronesiaMiddle AfricaMoldovaMoroccoNepalNetherlandsNicaraguaNigeriaNorth AmericaNorth MacedoniaNorthern AfricaNorthern EuropeNorwayOceaniaPakistanPanamaPeruPhilippinesPolandPortugalRomaniaRussiaSaudi ArabiaScotlandSenegalSerbiaSierra LeoneSingaporeSomaliaSouth AfricaSouth AmericaSouth Central AsiaSouth Eastern AsiaSouthern EuropeSpainSri LankaSt. Vincent and the GrenadinesSudanSwedenSwitzerlandSyriaTaiwanThailandTrinidad and TobagoTurkeyUgandaUkraineUruguayUzbekistanVenezuelaVietnamWest IndiesWestern AfricaWestern AsiaWestern EuropeYemenZaireZimbabweAzores
Family Households
Income
Poverty
Unemployment
Labor Participation
Family Structure
Vehicle Availability
Education Level
Disability

Family Households Comparison

Immigrants from Eastern Africa

Hopi

Tragic
Exceptional
61.1%
FAMILY HOUSEHOLDS
0.0/ 100
METRIC RATING
334th/ 347
METRIC RANK
65.3%
FAMILY HOUSEHOLDS
98.8/ 100
METRIC RATING
92nd/ 347
METRIC RANK

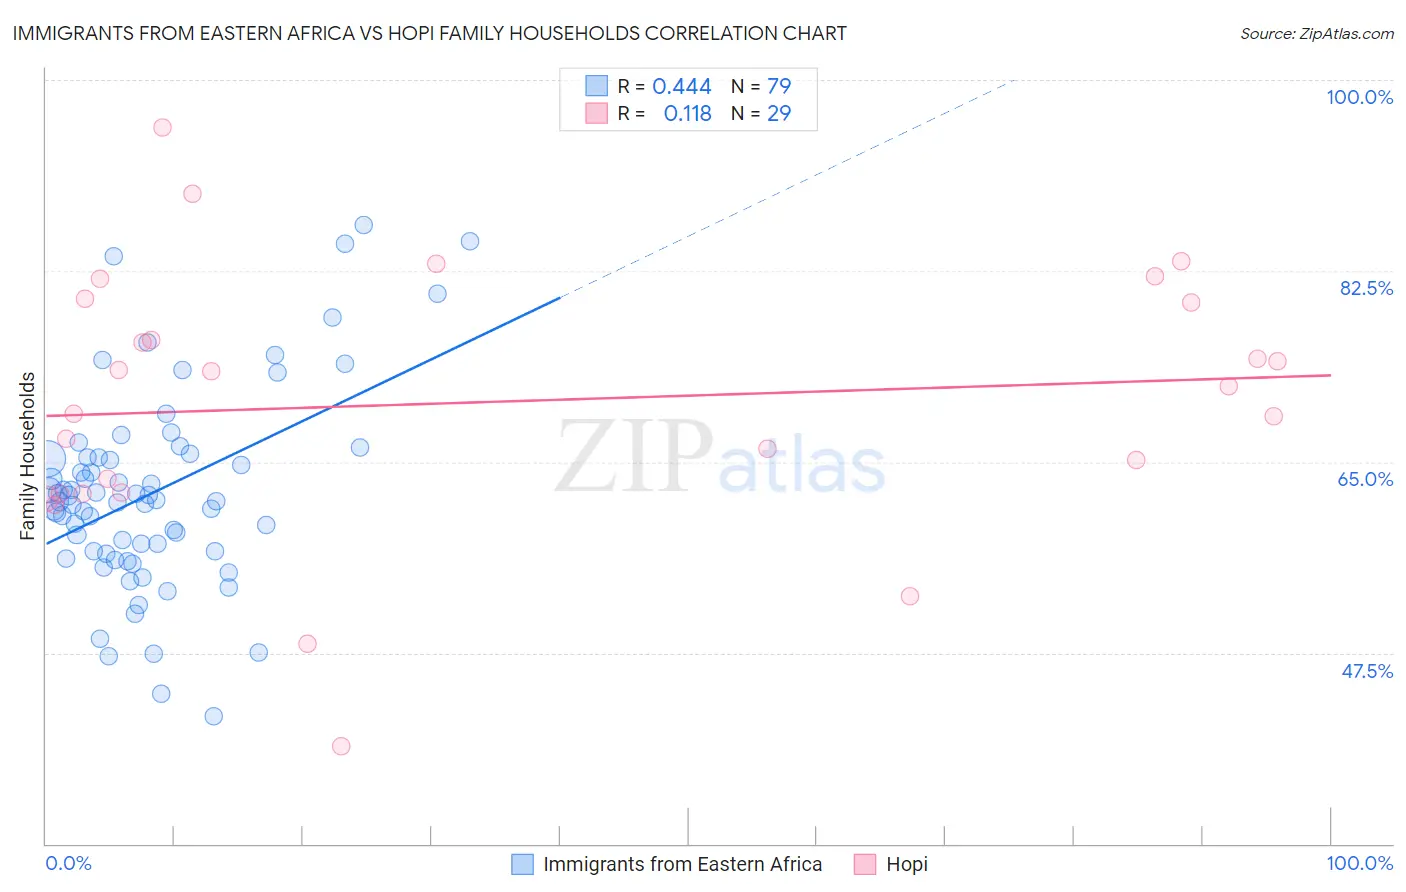
Immigrants from Eastern Africa vs Hopi Family Households Correlation Chart

The statistical analysis conducted on geographies consisting of 354,874,836 people shows a moderate positive correlation between the proportion of Immigrants from Eastern Africa and percentage of family households in the United States with a correlation coefficient (R) of 0.444 and weighted average of 61.1%. Similarly, the statistical analysis conducted on geographies consisting of 74,733,485 people shows a poor positive correlation between the proportion of Hopi and percentage of family households in the United States with a correlation coefficient (R) of 0.118 and weighted average of 65.3%, a difference of 6.7%.
Immigrants from Eastern Africa vs Hopi Family Households

Family Households Correlation Summary

MeasurementImmigrants from Eastern AfricaHopi
Minimum41.7%38.9%
Maximum86.7%95.7%
Range45.0%56.8%
Mean62.2%70.5%
Median61.4%72.0%
Interquartile 25% (IQ1)56.8%62.1%
Interquartile 75% (IQ3)65.4%79.8%
Interquartile Range (IQR)8.6%17.7%
Standard Deviation (Sample)9.1%12.2%
Standard Deviation (Population)9.0%12.0%

Similar Demographics by Family Households

Demographics Similar to Immigrants from Eastern Africa by Family Households

In terms of family households, the demographic groups most similar to Immigrants from Eastern Africa are Immigrants from Ethiopia (61.2%, a difference of 0.080%), Carpatho Rusyn (61.1%, a difference of 0.12%), Ethiopian (61.2%, a difference of 0.16%), Immigrants from Australia (61.3%, a difference of 0.24%), and Immigrants from France (61.3%, a difference of 0.24%).
DemographicsRating | RankFamily Households
Blacks/African Americans
0.0
/100
|
#327
Tragic
61.5%
Kiowa
0.0
/100
|
#328
Tragic
61.4%
Cambodians
0.0
/100
|
#329
Tragic
61.4%
Immigrants | Australia
0.0
/100
|
#330
Tragic
61.3%
Immigrants | France
0.0
/100
|
#331
Tragic
61.3%
Ethiopians
0.0
/100
|
#332
Tragic
61.2%
Immigrants | Ethiopia
0.0
/100
|
#333
Tragic
61.2%
Immigrants | Eastern Africa
0.0
/100
|
#334
Tragic
61.1%
Carpatho Rusyns
0.0
/100
|
#335
Tragic
61.1%
German Russians
0.0
/100
|
#336
Tragic
60.9%
Soviet Union
0.0
/100
|
#337
Tragic
60.9%
Immigrants | Eritrea
0.0
/100
|
#338
Tragic
60.8%
Immigrants | Saudi Arabia
0.0
/100
|
#339
Tragic
60.7%
Immigrants | Sudan
0.0
/100
|
#340
Tragic
60.2%
Immigrants | Senegal
0.0
/100
|
#341
Tragic
60.1%

Demographics Similar to Hopi by Family Households

In terms of family households, the demographic groups most similar to Hopi are Guyanese (65.3%, a difference of 0.0%), Immigrants from Poland (65.2%, a difference of 0.020%), Crow (65.3%, a difference of 0.040%), Immigrants from Portugal (65.2%, a difference of 0.050%), and Swiss (65.2%, a difference of 0.050%).
DemographicsRating | RankFamily Households
Immigrants | Cambodia
99.5
/100
|
#85
Exceptional
65.4%
Egyptians
99.4
/100
|
#86
Exceptional
65.4%
Immigrants | Egypt
99.2
/100
|
#87
Exceptional
65.3%
Immigrants | Haiti
99.1
/100
|
#88
Exceptional
65.3%
Immigrants | Caribbean
99.1
/100
|
#89
Exceptional
65.3%
Immigrants | Laos
99.1
/100
|
#90
Exceptional
65.3%
Crow
98.9
/100
|
#91
Exceptional
65.3%
Hopi
98.8
/100
|
#92
Exceptional
65.3%
Guyanese
98.8
/100
|
#93
Exceptional
65.3%
Immigrants | Poland
98.7
/100
|
#94
Exceptional
65.2%
Immigrants | Portugal
98.6
/100
|
#95
Exceptional
65.2%
Swiss
98.6
/100
|
#96
Exceptional
65.2%
Guatemalans
98.6
/100
|
#97
Exceptional
65.2%
Immigrants | Syria
98.4
/100
|
#98
Exceptional
65.2%
Central American Indians
98.3
/100
|
#99
Exceptional
65.2%