Immigrants from Eastern Africa vs Immigrants from Turkey Family Households
COMPARE
Immigrants from Eastern Africa
Immigrants from Turkey
Family Households
Family Households Comparison
Immigrants from Eastern Africa
Immigrants from Turkey
61.1%
FAMILY HOUSEHOLDS
0.0/ 100
METRIC RATING
334th/ 347
METRIC RANK
63.1%
FAMILY HOUSEHOLDS
0.3/ 100
METRIC RATING
272nd/ 347
METRIC RANK
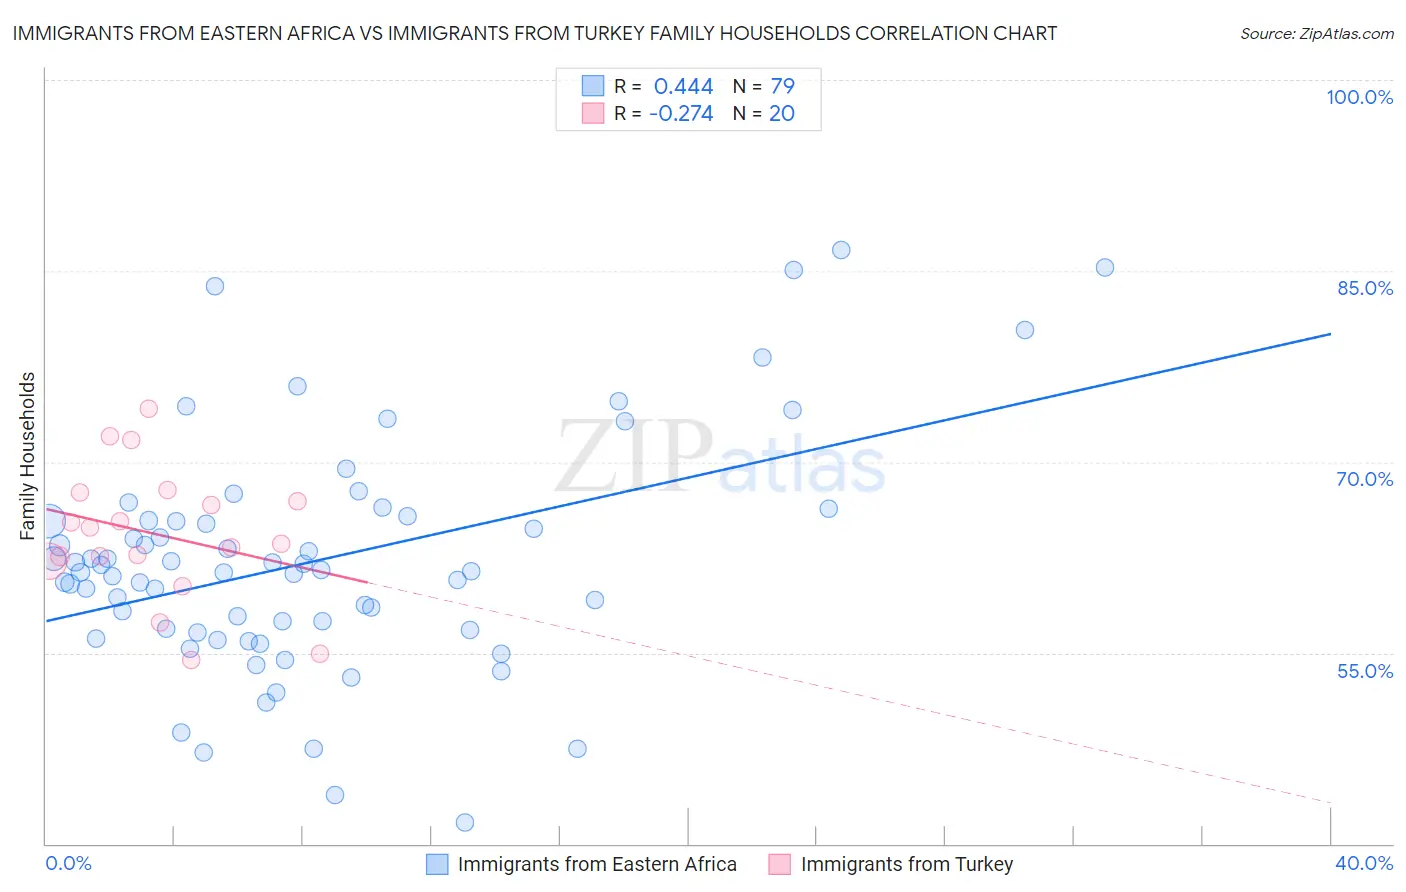
Immigrants from Eastern Africa vs Immigrants from Turkey Family Households Correlation Chart
The statistical analysis conducted on geographies consisting of 354,874,836 people shows a moderate positive correlation between the proportion of Immigrants from Eastern Africa and percentage of family households in the United States with a correlation coefficient (R) of 0.444 and weighted average of 61.1%. Similarly, the statistical analysis conducted on geographies consisting of 222,976,596 people shows a weak negative correlation between the proportion of Immigrants from Turkey and percentage of family households in the United States with a correlation coefficient (R) of -0.274 and weighted average of 63.1%, a difference of 3.1%.
Family Households Correlation Summary
| Measurement | Immigrants from Eastern Africa | Immigrants from Turkey |
| Minimum | 41.7% | 54.4% |
| Maximum | 86.7% | 74.1% |
| Range | 45.0% | 19.7% |
| Mean | 62.2% | 64.3% |
| Median | 61.4% | 64.2% |
| Interquartile 25% (IQ1) | 56.8% | 62.4% |
| Interquartile 75% (IQ3) | 65.4% | 67.3% |
| Interquartile Range (IQR) | 8.6% | 4.9% |
| Standard Deviation (Sample) | 9.1% | 5.2% |
| Standard Deviation (Population) | 9.0% | 5.1% |
Similar Demographics by Family Households
Demographics Similar to Immigrants from Eastern Africa by Family Households
In terms of family households, the demographic groups most similar to Immigrants from Eastern Africa are Immigrants from Ethiopia (61.2%, a difference of 0.080%), Carpatho Rusyn (61.1%, a difference of 0.12%), Ethiopian (61.2%, a difference of 0.16%), Immigrants from Australia (61.3%, a difference of 0.24%), and Immigrants from France (61.3%, a difference of 0.24%).
| Demographics | Rating | Rank | Family Households |
| Blacks/African Americans | 0.0 /100 | #327 | Tragic 61.5% |
| Kiowa | 0.0 /100 | #328 | Tragic 61.4% |
| Cambodians | 0.0 /100 | #329 | Tragic 61.4% |
| Immigrants | Australia | 0.0 /100 | #330 | Tragic 61.3% |
| Immigrants | France | 0.0 /100 | #331 | Tragic 61.3% |
| Ethiopians | 0.0 /100 | #332 | Tragic 61.2% |
| Immigrants | Ethiopia | 0.0 /100 | #333 | Tragic 61.2% |
| Immigrants | Eastern Africa | 0.0 /100 | #334 | Tragic 61.1% |
| Carpatho Rusyns | 0.0 /100 | #335 | Tragic 61.1% |
| German Russians | 0.0 /100 | #336 | Tragic 60.9% |
| Soviet Union | 0.0 /100 | #337 | Tragic 60.9% |
| Immigrants | Eritrea | 0.0 /100 | #338 | Tragic 60.8% |
| Immigrants | Saudi Arabia | 0.0 /100 | #339 | Tragic 60.7% |
| Immigrants | Sudan | 0.0 /100 | #340 | Tragic 60.2% |
| Immigrants | Senegal | 0.0 /100 | #341 | Tragic 60.1% |
Demographics Similar to Immigrants from Turkey by Family Households
In terms of family households, the demographic groups most similar to Immigrants from Turkey are Immigrants from Croatia (63.1%, a difference of 0.0%), Immigrants from Austria (63.1%, a difference of 0.010%), Immigrants from Kazakhstan (63.1%, a difference of 0.010%), Lumbee (63.1%, a difference of 0.020%), and West Indian (63.1%, a difference of 0.020%).
| Demographics | Rating | Rank | Family Households |
| Colville | 0.5 /100 | #265 | Tragic 63.2% |
| Immigrants | Western Africa | 0.5 /100 | #266 | Tragic 63.1% |
| Israelis | 0.4 /100 | #267 | Tragic 63.1% |
| Immigrants | Singapore | 0.4 /100 | #268 | Tragic 63.1% |
| Yugoslavians | 0.4 /100 | #269 | Tragic 63.1% |
| Immigrants | Austria | 0.3 /100 | #270 | Tragic 63.1% |
| Immigrants | Croatia | 0.3 /100 | #271 | Tragic 63.1% |
| Immigrants | Turkey | 0.3 /100 | #272 | Tragic 63.1% |
| Immigrants | Kazakhstan | 0.3 /100 | #273 | Tragic 63.1% |
| Lumbee | 0.3 /100 | #274 | Tragic 63.1% |
| West Indians | 0.3 /100 | #275 | Tragic 63.1% |
| Serbians | 0.3 /100 | #276 | Tragic 63.0% |
| Ottawa | 0.3 /100 | #277 | Tragic 63.0% |
| Immigrants | Belgium | 0.2 /100 | #278 | Tragic 63.0% |
| Immigrants | Yemen | 0.2 /100 | #279 | Tragic 63.0% |