Immigrants from China vs Portuguese Divorced or Separated
COMPARE
Immigrants from China
Portuguese
Divorced or Separated
Divorced or Separated Comparison
Immigrants from China
Portuguese
10.0%
DIVORCED OR SEPARATED
100.0/ 100
METRIC RATING
4th/ 347
METRIC RANK
12.2%
DIVORCED OR SEPARATED
23.5/ 100
METRIC RATING
202nd/ 347
METRIC RANK
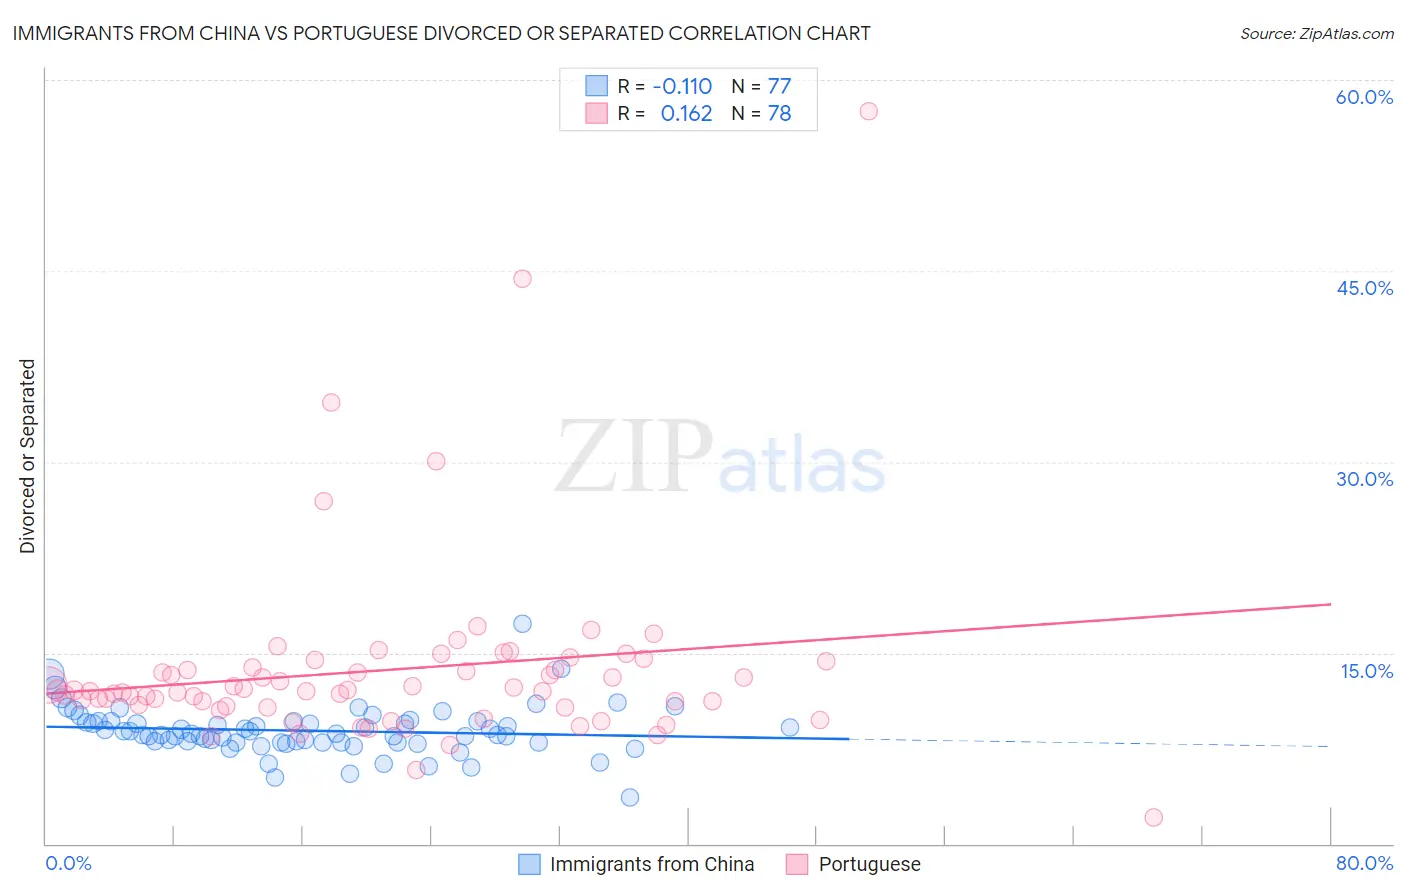
Immigrants from China vs Portuguese Divorced or Separated Correlation Chart
The statistical analysis conducted on geographies consisting of 456,716,224 people shows a poor negative correlation between the proportion of Immigrants from China and percentage of population currently divorced or separated in the United States with a correlation coefficient (R) of -0.110 and weighted average of 10.0%. Similarly, the statistical analysis conducted on geographies consisting of 450,104,326 people shows a poor positive correlation between the proportion of Portuguese and percentage of population currently divorced or separated in the United States with a correlation coefficient (R) of 0.162 and weighted average of 12.2%, a difference of 21.3%.
Divorced or Separated Correlation Summary
| Measurement | Immigrants from China | Portuguese |
| Minimum | 3.6% | 2.1% |
| Maximum | 17.3% | 57.5% |
| Range | 13.7% | 55.4% |
| Mean | 8.9% | 13.6% |
| Median | 8.6% | 12.0% |
| Interquartile 25% (IQ1) | 8.0% | 10.8% |
| Interquartile 75% (IQ3) | 9.6% | 13.9% |
| Interquartile Range (IQR) | 1.6% | 3.1% |
| Standard Deviation (Sample) | 1.9% | 7.6% |
| Standard Deviation (Population) | 1.9% | 7.5% |
Similar Demographics by Divorced or Separated
Demographics Similar to Immigrants from China by Divorced or Separated
In terms of divorced or separated, the demographic groups most similar to Immigrants from China are Immigrants from India (10.1%, a difference of 0.23%), Immigrants from Hong Kong (10.0%, a difference of 0.72%), Filipino (9.9%, a difference of 1.3%), Indian (Asian) (10.2%, a difference of 1.6%), and Thai (10.2%, a difference of 1.6%).
| Demographics | Rating | Rank | Divorced or Separated |
| Immigrants | Taiwan | 100.0 /100 | #1 | Exceptional 9.8% |
| Filipinos | 100.0 /100 | #2 | Exceptional 9.9% |
| Immigrants | Hong Kong | 100.0 /100 | #3 | Exceptional 10.0% |
| Immigrants | China | 100.0 /100 | #4 | Exceptional 10.0% |
| Immigrants | India | 100.0 /100 | #5 | Exceptional 10.1% |
| Indians (Asian) | 100.0 /100 | #6 | Exceptional 10.2% |
| Thais | 100.0 /100 | #7 | Exceptional 10.2% |
| Immigrants | Eastern Asia | 100.0 /100 | #8 | Exceptional 10.2% |
| Yup'ik | 100.0 /100 | #9 | Exceptional 10.3% |
| Immigrants | Singapore | 100.0 /100 | #10 | Exceptional 10.3% |
| Immigrants | South Central Asia | 100.0 /100 | #11 | Exceptional 10.4% |
| Okinawans | 100.0 /100 | #12 | Exceptional 10.5% |
| Cypriots | 100.0 /100 | #13 | Exceptional 10.5% |
| Assyrians/Chaldeans/Syriacs | 100.0 /100 | #14 | Exceptional 10.6% |
| Immigrants | Armenia | 100.0 /100 | #15 | Exceptional 10.6% |
Demographics Similar to Portuguese by Divorced or Separated
In terms of divorced or separated, the demographic groups most similar to Portuguese are Immigrants from Guatemala (12.2%, a difference of 0.020%), Kenyan (12.2%, a difference of 0.080%), Immigrants from Costa Rica (12.2%, a difference of 0.11%), Slovak (12.2%, a difference of 0.12%), and Mexican (12.2%, a difference of 0.13%).
| Demographics | Rating | Rank | Divorced or Separated |
| Immigrants | England | 31.4 /100 | #195 | Fair 12.1% |
| Immigrants | Burma/Myanmar | 30.4 /100 | #196 | Fair 12.1% |
| Immigrants | Africa | 30.3 /100 | #197 | Fair 12.1% |
| Nigerians | 30.1 /100 | #198 | Fair 12.1% |
| Central Americans | 29.4 /100 | #199 | Fair 12.1% |
| South Americans | 28.6 /100 | #200 | Fair 12.2% |
| Guatemalans | 26.9 /100 | #201 | Fair 12.2% |
| Portuguese | 23.5 /100 | #202 | Fair 12.2% |
| Immigrants | Guatemala | 23.2 /100 | #203 | Fair 12.2% |
| Kenyans | 21.8 /100 | #204 | Fair 12.2% |
| Immigrants | Costa Rica | 21.3 /100 | #205 | Fair 12.2% |
| Slovaks | 21.0 /100 | #206 | Fair 12.2% |
| Mexicans | 21.0 /100 | #207 | Fair 12.2% |
| Immigrants | Ghana | 18.8 /100 | #208 | Poor 12.2% |
| Immigrants | Trinidad and Tobago | 17.8 /100 | #209 | Poor 12.2% |