Immigrants from China vs Immigrants from Southern Europe Divorced or Separated
COMPARE
Immigrants from China
Immigrants from Southern Europe
Divorced or Separated
Divorced or Separated Comparison
Immigrants from China
Immigrants from Southern Europe
10.0%
DIVORCED OR SEPARATED
100.0/ 100
METRIC RATING
4th/ 347
METRIC RANK
11.6%
DIVORCED OR SEPARATED
99.1/ 100
METRIC RATING
89th/ 347
METRIC RANK
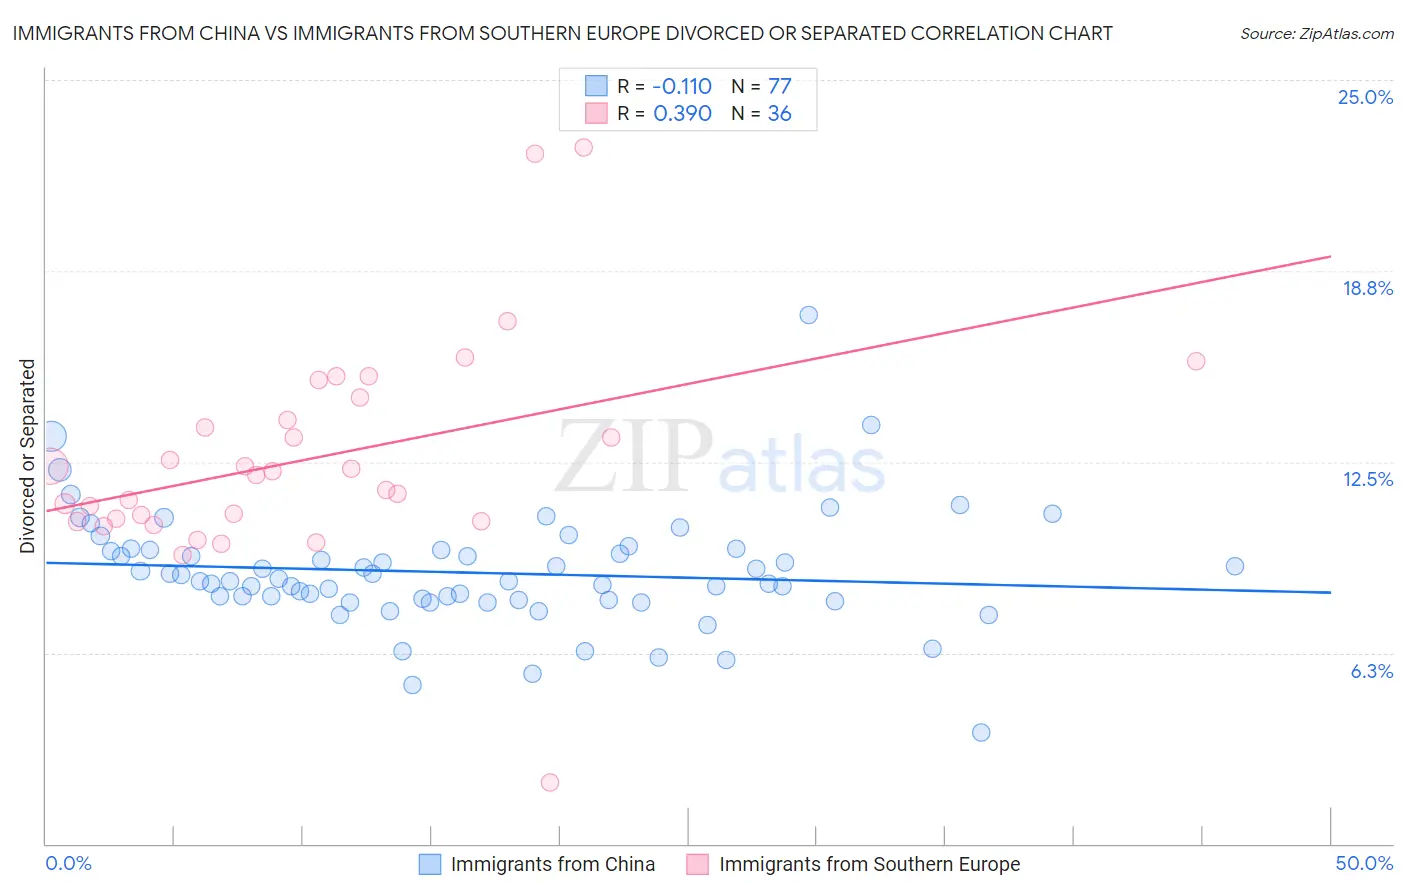
Immigrants from China vs Immigrants from Southern Europe Divorced or Separated Correlation Chart
The statistical analysis conducted on geographies consisting of 456,716,224 people shows a poor negative correlation between the proportion of Immigrants from China and percentage of population currently divorced or separated in the United States with a correlation coefficient (R) of -0.110 and weighted average of 10.0%. Similarly, the statistical analysis conducted on geographies consisting of 402,653,833 people shows a mild positive correlation between the proportion of Immigrants from Southern Europe and percentage of population currently divorced or separated in the United States with a correlation coefficient (R) of 0.390 and weighted average of 11.6%, a difference of 15.2%.
Divorced or Separated Correlation Summary
| Measurement | Immigrants from China | Immigrants from Southern Europe |
| Minimum | 3.6% | 2.0% |
| Maximum | 17.3% | 22.8% |
| Range | 13.7% | 20.8% |
| Mean | 8.9% | 12.6% |
| Median | 8.6% | 12.1% |
| Interquartile 25% (IQ1) | 8.0% | 10.6% |
| Interquartile 75% (IQ3) | 9.6% | 14.2% |
| Interquartile Range (IQR) | 1.6% | 3.6% |
| Standard Deviation (Sample) | 1.9% | 3.6% |
| Standard Deviation (Population) | 1.9% | 3.6% |
Similar Demographics by Divorced or Separated
Demographics Similar to Immigrants from China by Divorced or Separated
In terms of divorced or separated, the demographic groups most similar to Immigrants from China are Immigrants from India (10.1%, a difference of 0.23%), Immigrants from Hong Kong (10.0%, a difference of 0.72%), Filipino (9.9%, a difference of 1.3%), Indian (Asian) (10.2%, a difference of 1.6%), and Thai (10.2%, a difference of 1.6%).
| Demographics | Rating | Rank | Divorced or Separated |
| Immigrants | Taiwan | 100.0 /100 | #1 | Exceptional 9.8% |
| Filipinos | 100.0 /100 | #2 | Exceptional 9.9% |
| Immigrants | Hong Kong | 100.0 /100 | #3 | Exceptional 10.0% |
| Immigrants | China | 100.0 /100 | #4 | Exceptional 10.0% |
| Immigrants | India | 100.0 /100 | #5 | Exceptional 10.1% |
| Indians (Asian) | 100.0 /100 | #6 | Exceptional 10.2% |
| Thais | 100.0 /100 | #7 | Exceptional 10.2% |
| Immigrants | Eastern Asia | 100.0 /100 | #8 | Exceptional 10.2% |
| Yup'ik | 100.0 /100 | #9 | Exceptional 10.3% |
| Immigrants | Singapore | 100.0 /100 | #10 | Exceptional 10.3% |
| Immigrants | South Central Asia | 100.0 /100 | #11 | Exceptional 10.4% |
| Okinawans | 100.0 /100 | #12 | Exceptional 10.5% |
| Cypriots | 100.0 /100 | #13 | Exceptional 10.5% |
| Assyrians/Chaldeans/Syriacs | 100.0 /100 | #14 | Exceptional 10.6% |
| Immigrants | Armenia | 100.0 /100 | #15 | Exceptional 10.6% |
Demographics Similar to Immigrants from Southern Europe by Divorced or Separated
In terms of divorced or separated, the demographic groups most similar to Immigrants from Southern Europe are Immigrants from Europe (11.6%, a difference of 0.040%), Immigrants from Nepal (11.6%, a difference of 0.070%), Immigrants from Latvia (11.6%, a difference of 0.090%), Zimbabwean (11.6%, a difference of 0.10%), and Spanish American Indian (11.6%, a difference of 0.14%).
| Demographics | Rating | Rank | Divorced or Separated |
| Immigrants | Romania | 99.3 /100 | #82 | Exceptional 11.5% |
| Immigrants | Bulgaria | 99.3 /100 | #83 | Exceptional 11.5% |
| Bulgarians | 99.3 /100 | #84 | Exceptional 11.5% |
| Immigrants | Albania | 99.3 /100 | #85 | Exceptional 11.5% |
| Immigrants | Latvia | 99.2 /100 | #86 | Exceptional 11.6% |
| Immigrants | Nepal | 99.2 /100 | #87 | Exceptional 11.6% |
| Immigrants | Europe | 99.2 /100 | #88 | Exceptional 11.6% |
| Immigrants | Southern Europe | 99.1 /100 | #89 | Exceptional 11.6% |
| Zimbabweans | 99.0 /100 | #90 | Exceptional 11.6% |
| Spanish American Indians | 99.0 /100 | #91 | Exceptional 11.6% |
| Immigrants | Denmark | 98.9 /100 | #92 | Exceptional 11.6% |
| Arabs | 98.9 /100 | #93 | Exceptional 11.6% |
| Immigrants | Fiji | 98.9 /100 | #94 | Exceptional 11.6% |
| Immigrants | Serbia | 98.8 /100 | #95 | Exceptional 11.6% |
| Immigrants | Ukraine | 98.7 /100 | #96 | Exceptional 11.6% |