Immigrants from Central America vs Arapaho Family Households
COMPARE
Immigrants from Central America
Arapaho
Family Households
Family Households Comparison
Immigrants from Central America
Arapaho
68.3%
FAMILY HOUSEHOLDS
100.0/ 100
METRIC RATING
11th/ 347
METRIC RANK
66.5%
FAMILY HOUSEHOLDS
100.0/ 100
METRIC RATING
46th/ 347
METRIC RANK
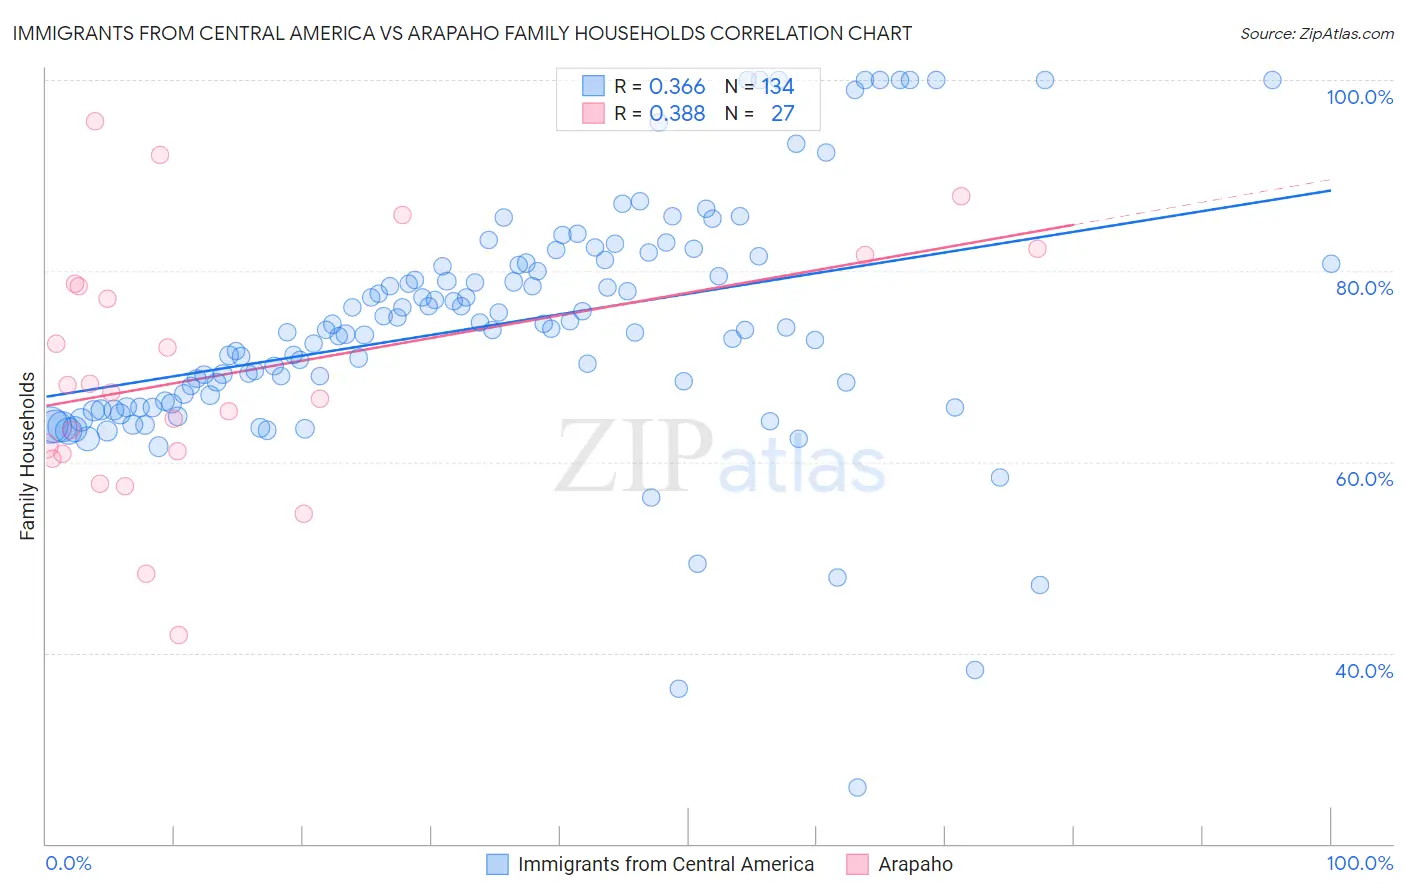
Immigrants from Central America vs Arapaho Family Households Correlation Chart
The statistical analysis conducted on geographies consisting of 536,086,114 people shows a mild positive correlation between the proportion of Immigrants from Central America and percentage of family households in the United States with a correlation coefficient (R) of 0.366 and weighted average of 68.3%. Similarly, the statistical analysis conducted on geographies consisting of 29,778,233 people shows a mild positive correlation between the proportion of Arapaho and percentage of family households in the United States with a correlation coefficient (R) of 0.388 and weighted average of 66.5%, a difference of 2.7%.
Family Households Correlation Summary
| Measurement | Immigrants from Central America | Arapaho |
| Minimum | 25.8% | 41.9% |
| Maximum | 100.0% | 95.7% |
| Range | 74.2% | 53.8% |
| Mean | 74.3% | 69.3% |
| Median | 73.9% | 67.2% |
| Interquartile 25% (IQ1) | 66.1% | 60.8% |
| Interquartile 75% (IQ3) | 80.8% | 78.6% |
| Interquartile Range (IQR) | 14.7% | 17.8% |
| Standard Deviation (Sample) | 12.7% | 13.1% |
| Standard Deviation (Population) | 12.7% | 12.9% |
Similar Demographics by Family Households
Demographics Similar to Immigrants from Central America by Family Households
In terms of family households, the demographic groups most similar to Immigrants from Central America are Korean (68.3%, a difference of 0.030%), Immigrants from Philippines (68.3%, a difference of 0.070%), Pueblo (68.2%, a difference of 0.11%), Immigrants from Cuba (68.2%, a difference of 0.12%), and Native Hawaiian (68.4%, a difference of 0.14%).
| Demographics | Rating | Rank | Family Households |
| Yakama | 100.0 /100 | #4 | Exceptional 69.3% |
| Yuman | 100.0 /100 | #5 | Exceptional 69.3% |
| Immigrants | Mexico | 100.0 /100 | #6 | Exceptional 69.1% |
| Mexicans | 100.0 /100 | #7 | Exceptional 69.0% |
| Immigrants | Fiji | 100.0 /100 | #8 | Exceptional 68.8% |
| Native Hawaiians | 100.0 /100 | #9 | Exceptional 68.4% |
| Immigrants | Philippines | 100.0 /100 | #10 | Exceptional 68.3% |
| Immigrants | Central America | 100.0 /100 | #11 | Exceptional 68.3% |
| Koreans | 100.0 /100 | #12 | Exceptional 68.3% |
| Pueblo | 100.0 /100 | #13 | Exceptional 68.2% |
| Immigrants | Cuba | 100.0 /100 | #14 | Exceptional 68.2% |
| Assyrians/Chaldeans/Syriacs | 100.0 /100 | #15 | Exceptional 68.2% |
| Immigrants | Vietnam | 100.0 /100 | #16 | Exceptional 68.2% |
| Chinese | 100.0 /100 | #17 | Exceptional 68.1% |
| Immigrants | Taiwan | 100.0 /100 | #18 | Exceptional 68.0% |
Demographics Similar to Arapaho by Family Households
In terms of family households, the demographic groups most similar to Arapaho are Venezuelan (66.5%, a difference of 0.020%), Bolivian (66.5%, a difference of 0.030%), Asian (66.5%, a difference of 0.050%), Immigrants from Venezuela (66.4%, a difference of 0.050%), and Apache (66.5%, a difference of 0.090%).
| Demographics | Rating | Rank | Family Households |
| Immigrants | El Salvador | 100.0 /100 | #39 | Exceptional 67.0% |
| Guamanians/Chamorros | 100.0 /100 | #40 | Exceptional 66.6% |
| Immigrants | Bolivia | 100.0 /100 | #41 | Exceptional 66.6% |
| Menominee | 100.0 /100 | #42 | Exceptional 66.5% |
| Apache | 100.0 /100 | #43 | Exceptional 66.5% |
| Asians | 100.0 /100 | #44 | Exceptional 66.5% |
| Venezuelans | 100.0 /100 | #45 | Exceptional 66.5% |
| Arapaho | 100.0 /100 | #46 | Exceptional 66.5% |
| Bolivians | 100.0 /100 | #47 | Exceptional 66.5% |
| Immigrants | Venezuela | 100.0 /100 | #48 | Exceptional 66.4% |
| Immigrants | South Central Asia | 100.0 /100 | #49 | Exceptional 66.4% |
| Navajo | 100.0 /100 | #50 | Exceptional 66.4% |
| Natives/Alaskans | 100.0 /100 | #51 | Exceptional 66.4% |
| Colombians | 100.0 /100 | #52 | Exceptional 66.3% |
| Afghans | 100.0 /100 | #53 | Exceptional 66.3% |