Immigrants from Central America vs Egyptian Family Households
COMPARE
Immigrants from Central America
Egyptian
Family Households
Family Households Comparison
Immigrants from Central America
Egyptians
68.3%
FAMILY HOUSEHOLDS
100.0/ 100
METRIC RATING
11th/ 347
METRIC RANK
65.4%
FAMILY HOUSEHOLDS
99.4/ 100
METRIC RATING
86th/ 347
METRIC RANK
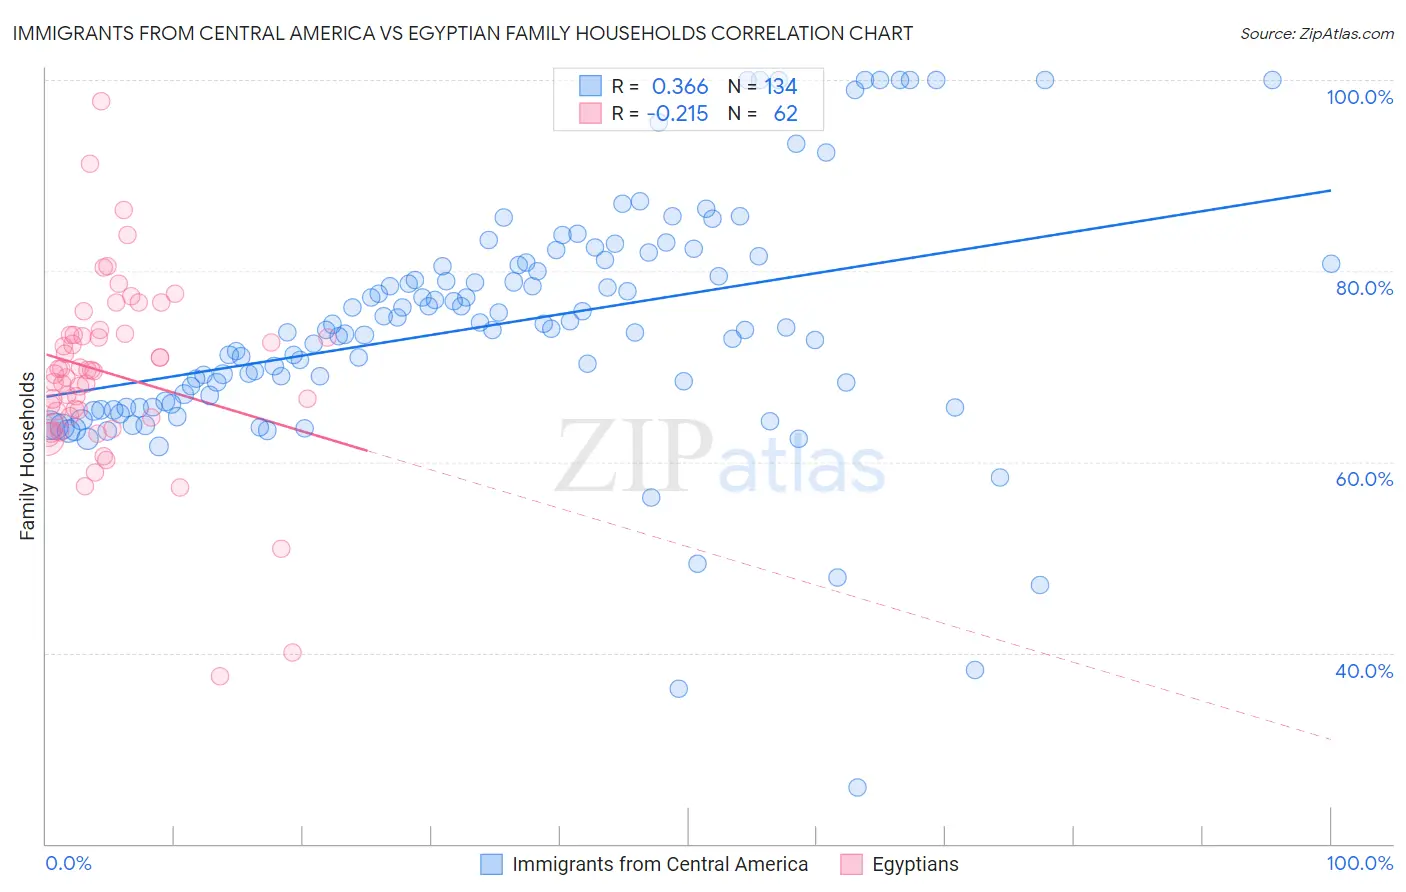
Immigrants from Central America vs Egyptian Family Households Correlation Chart
The statistical analysis conducted on geographies consisting of 536,086,114 people shows a mild positive correlation between the proportion of Immigrants from Central America and percentage of family households in the United States with a correlation coefficient (R) of 0.366 and weighted average of 68.3%. Similarly, the statistical analysis conducted on geographies consisting of 276,780,466 people shows a weak negative correlation between the proportion of Egyptians and percentage of family households in the United States with a correlation coefficient (R) of -0.215 and weighted average of 65.4%, a difference of 4.4%.
Family Households Correlation Summary
| Measurement | Immigrants from Central America | Egyptian |
| Minimum | 25.8% | 37.6% |
| Maximum | 100.0% | 97.8% |
| Range | 74.2% | 60.2% |
| Mean | 74.3% | 69.2% |
| Median | 73.9% | 69.5% |
| Interquartile 25% (IQ1) | 66.1% | 64.8% |
| Interquartile 75% (IQ3) | 80.8% | 73.3% |
| Interquartile Range (IQR) | 14.7% | 8.6% |
| Standard Deviation (Sample) | 12.7% | 9.7% |
| Standard Deviation (Population) | 12.7% | 9.6% |
Similar Demographics by Family Households
Demographics Similar to Immigrants from Central America by Family Households
In terms of family households, the demographic groups most similar to Immigrants from Central America are Korean (68.3%, a difference of 0.030%), Immigrants from Philippines (68.3%, a difference of 0.070%), Pueblo (68.2%, a difference of 0.11%), Immigrants from Cuba (68.2%, a difference of 0.12%), and Native Hawaiian (68.4%, a difference of 0.14%).
| Demographics | Rating | Rank | Family Households |
| Yakama | 100.0 /100 | #4 | Exceptional 69.3% |
| Yuman | 100.0 /100 | #5 | Exceptional 69.3% |
| Immigrants | Mexico | 100.0 /100 | #6 | Exceptional 69.1% |
| Mexicans | 100.0 /100 | #7 | Exceptional 69.0% |
| Immigrants | Fiji | 100.0 /100 | #8 | Exceptional 68.8% |
| Native Hawaiians | 100.0 /100 | #9 | Exceptional 68.4% |
| Immigrants | Philippines | 100.0 /100 | #10 | Exceptional 68.3% |
| Immigrants | Central America | 100.0 /100 | #11 | Exceptional 68.3% |
| Koreans | 100.0 /100 | #12 | Exceptional 68.3% |
| Pueblo | 100.0 /100 | #13 | Exceptional 68.2% |
| Immigrants | Cuba | 100.0 /100 | #14 | Exceptional 68.2% |
| Assyrians/Chaldeans/Syriacs | 100.0 /100 | #15 | Exceptional 68.2% |
| Immigrants | Vietnam | 100.0 /100 | #16 | Exceptional 68.2% |
| Chinese | 100.0 /100 | #17 | Exceptional 68.1% |
| Immigrants | Taiwan | 100.0 /100 | #18 | Exceptional 68.0% |
Demographics Similar to Egyptians by Family Households
In terms of family households, the demographic groups most similar to Egyptians are Immigrants from Cambodia (65.4%, a difference of 0.050%), Immigrants from Egypt (65.3%, a difference of 0.090%), Immigrants from Haiti (65.3%, a difference of 0.12%), Immigrants from Caribbean (65.3%, a difference of 0.13%), and Immigrants from Laos (65.3%, a difference of 0.14%).
| Demographics | Rating | Rank | Family Households |
| Immigrants | Costa Rica | 99.8 /100 | #79 | Exceptional 65.6% |
| Puget Sound Salish | 99.8 /100 | #80 | Exceptional 65.6% |
| Jordanians | 99.7 /100 | #81 | Exceptional 65.5% |
| Immigrants | Lebanon | 99.7 /100 | #82 | Exceptional 65.5% |
| Immigrants | Guyana | 99.6 /100 | #83 | Exceptional 65.5% |
| Americans | 99.6 /100 | #84 | Exceptional 65.5% |
| Immigrants | Cambodia | 99.5 /100 | #85 | Exceptional 65.4% |
| Egyptians | 99.4 /100 | #86 | Exceptional 65.4% |
| Immigrants | Egypt | 99.2 /100 | #87 | Exceptional 65.3% |
| Immigrants | Haiti | 99.1 /100 | #88 | Exceptional 65.3% |
| Immigrants | Caribbean | 99.1 /100 | #89 | Exceptional 65.3% |
| Immigrants | Laos | 99.1 /100 | #90 | Exceptional 65.3% |
| Crow | 98.9 /100 | #91 | Exceptional 65.3% |
| Hopi | 98.8 /100 | #92 | Exceptional 65.3% |
| Guyanese | 98.8 /100 | #93 | Exceptional 65.3% |