Immigrants from Central America vs Polish Family Households
COMPARE
Immigrants from Central America
Polish
Family Households
Family Households Comparison
Immigrants from Central America
Poles
68.3%
FAMILY HOUSEHOLDS
100.0/ 100
METRIC RATING
11th/ 347
METRIC RANK
64.0%
FAMILY HOUSEHOLDS
18.9/ 100
METRIC RATING
198th/ 347
METRIC RANK
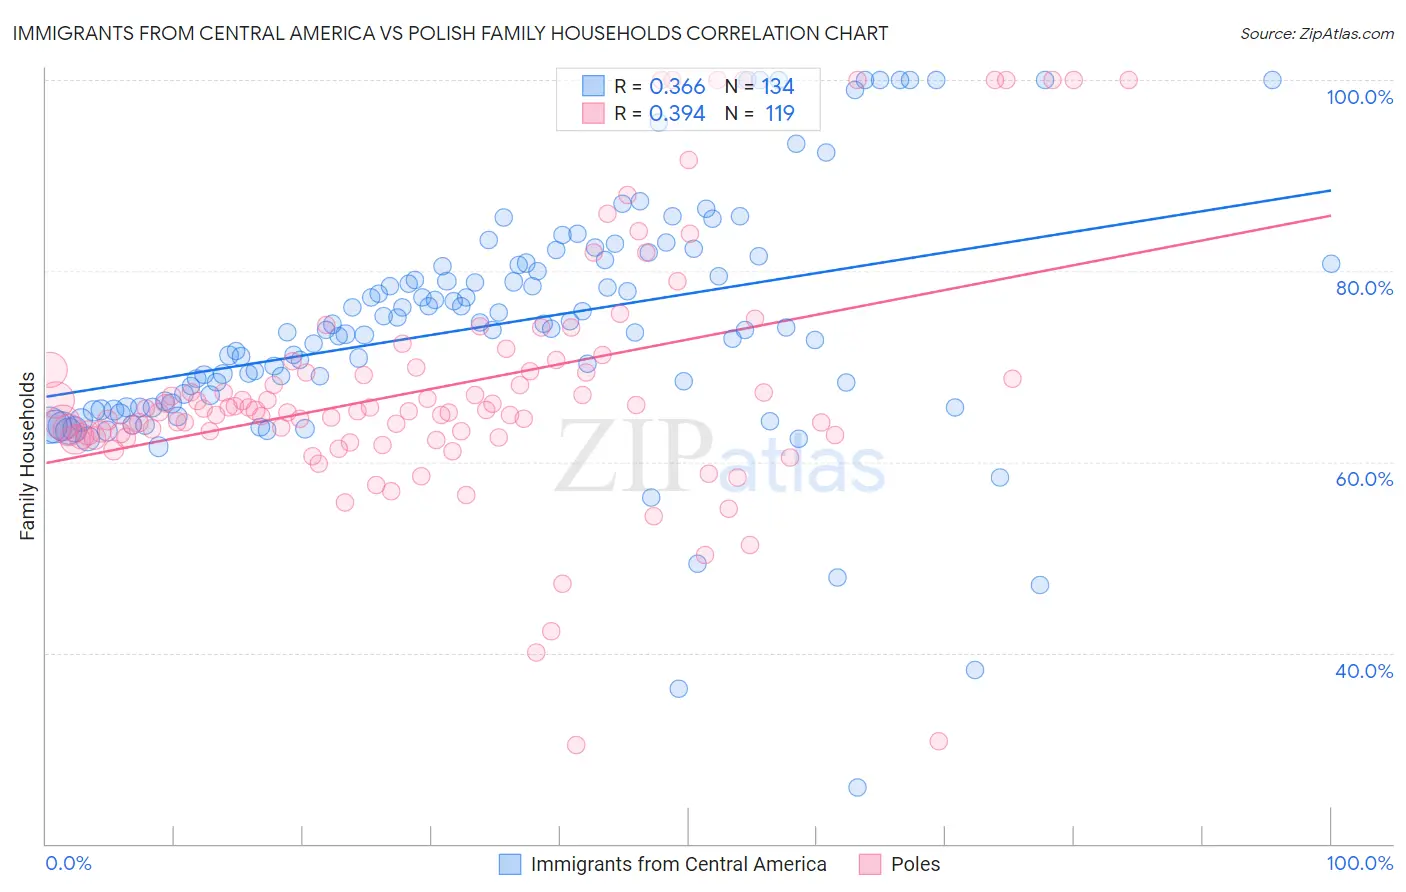
Immigrants from Central America vs Polish Family Households Correlation Chart
The statistical analysis conducted on geographies consisting of 536,086,114 people shows a mild positive correlation between the proportion of Immigrants from Central America and percentage of family households in the United States with a correlation coefficient (R) of 0.366 and weighted average of 68.3%. Similarly, the statistical analysis conducted on geographies consisting of 559,976,877 people shows a mild positive correlation between the proportion of Poles and percentage of family households in the United States with a correlation coefficient (R) of 0.394 and weighted average of 64.0%, a difference of 6.7%.
Family Households Correlation Summary
| Measurement | Immigrants from Central America | Polish |
| Minimum | 25.8% | 30.3% |
| Maximum | 100.0% | 100.0% |
| Range | 74.2% | 69.7% |
| Mean | 74.3% | 68.0% |
| Median | 73.9% | 65.4% |
| Interquartile 25% (IQ1) | 66.1% | 62.7% |
| Interquartile 75% (IQ3) | 80.8% | 69.9% |
| Interquartile Range (IQR) | 14.7% | 7.2% |
| Standard Deviation (Sample) | 12.7% | 13.1% |
| Standard Deviation (Population) | 12.7% | 13.1% |
Similar Demographics by Family Households
Demographics Similar to Immigrants from Central America by Family Households
In terms of family households, the demographic groups most similar to Immigrants from Central America are Korean (68.3%, a difference of 0.030%), Immigrants from Philippines (68.3%, a difference of 0.070%), Pueblo (68.2%, a difference of 0.11%), Immigrants from Cuba (68.2%, a difference of 0.12%), and Native Hawaiian (68.4%, a difference of 0.14%).
| Demographics | Rating | Rank | Family Households |
| Yakama | 100.0 /100 | #4 | Exceptional 69.3% |
| Yuman | 100.0 /100 | #5 | Exceptional 69.3% |
| Immigrants | Mexico | 100.0 /100 | #6 | Exceptional 69.1% |
| Mexicans | 100.0 /100 | #7 | Exceptional 69.0% |
| Immigrants | Fiji | 100.0 /100 | #8 | Exceptional 68.8% |
| Native Hawaiians | 100.0 /100 | #9 | Exceptional 68.4% |
| Immigrants | Philippines | 100.0 /100 | #10 | Exceptional 68.3% |
| Immigrants | Central America | 100.0 /100 | #11 | Exceptional 68.3% |
| Koreans | 100.0 /100 | #12 | Exceptional 68.3% |
| Pueblo | 100.0 /100 | #13 | Exceptional 68.2% |
| Immigrants | Cuba | 100.0 /100 | #14 | Exceptional 68.2% |
| Assyrians/Chaldeans/Syriacs | 100.0 /100 | #15 | Exceptional 68.2% |
| Immigrants | Vietnam | 100.0 /100 | #16 | Exceptional 68.2% |
| Chinese | 100.0 /100 | #17 | Exceptional 68.1% |
| Immigrants | Taiwan | 100.0 /100 | #18 | Exceptional 68.0% |
Demographics Similar to Poles by Family Households
In terms of family households, the demographic groups most similar to Poles are Seminole (64.0%, a difference of 0.0%), Immigrants from Canada (64.0%, a difference of 0.010%), Slavic (64.0%, a difference of 0.010%), Immigrants from North America (64.0%, a difference of 0.020%), and Immigrants from Malaysia (64.0%, a difference of 0.020%).
| Demographics | Rating | Rank | Family Households |
| Arabs | 24.5 /100 | #191 | Fair 64.1% |
| Lithuanians | 23.8 /100 | #192 | Fair 64.0% |
| French | 23.7 /100 | #193 | Fair 64.0% |
| Paiute | 22.2 /100 | #194 | Fair 64.0% |
| Immigrants | North America | 20.0 /100 | #195 | Poor 64.0% |
| Immigrants | Canada | 19.2 /100 | #196 | Poor 64.0% |
| Seminole | 18.9 /100 | #197 | Poor 64.0% |
| Poles | 18.9 /100 | #198 | Poor 64.0% |
| Slavs | 18.6 /100 | #199 | Poor 64.0% |
| Immigrants | Malaysia | 17.9 /100 | #200 | Poor 64.0% |
| Immigrants | Eastern Europe | 17.2 /100 | #201 | Poor 64.0% |
| Iranians | 13.5 /100 | #202 | Poor 63.9% |
| Norwegians | 13.2 /100 | #203 | Poor 63.9% |
| Immigrants | Uruguay | 12.8 /100 | #204 | Poor 63.9% |
| Brazilians | 12.4 /100 | #205 | Poor 63.9% |