Carpatho Rusyn vs Latvian Currently Married
COMPARE
Carpatho Rusyn
Latvian
Currently Married
Currently Married Comparison
Carpatho Rusyns
Latvians
47.0%
CURRENTLY MARRIED
72.6/ 100
METRIC RATING
146th/ 347
METRIC RANK
48.5%
CURRENTLY MARRIED
98.7/ 100
METRIC RATING
56th/ 347
METRIC RANK
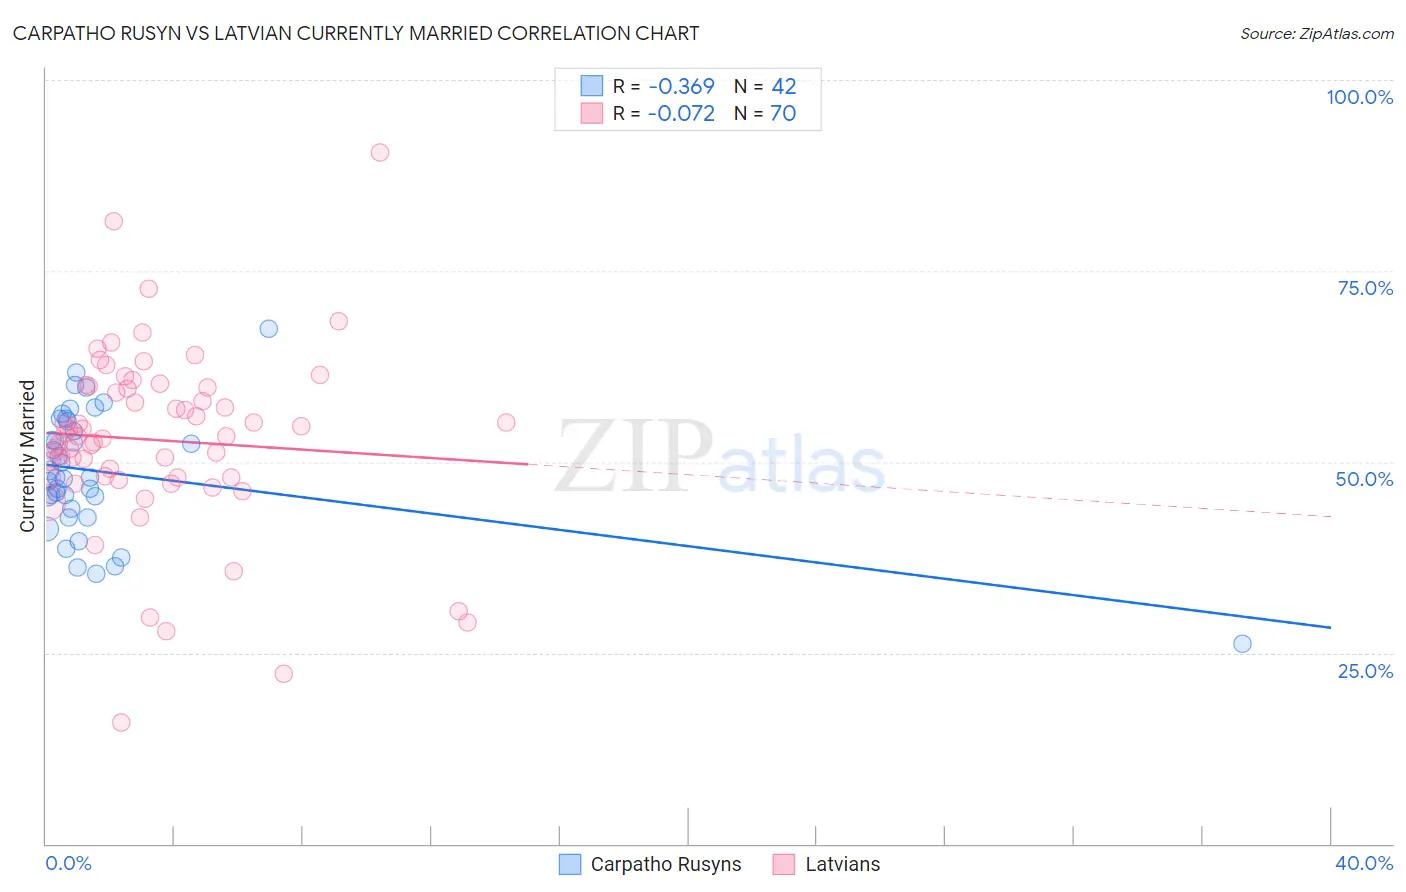
Carpatho Rusyn vs Latvian Currently Married Correlation Chart
The statistical analysis conducted on geographies consisting of 58,871,690 people shows a mild negative correlation between the proportion of Carpatho Rusyns and percentage of population currently married in the United States with a correlation coefficient (R) of -0.369 and weighted average of 47.0%. Similarly, the statistical analysis conducted on geographies consisting of 220,695,418 people shows a slight negative correlation between the proportion of Latvians and percentage of population currently married in the United States with a correlation coefficient (R) of -0.072 and weighted average of 48.5%, a difference of 3.0%.
Currently Married Correlation Summary
| Measurement | Carpatho Rusyn | Latvian |
| Minimum | 26.2% | 15.8% |
| Maximum | 67.5% | 90.5% |
| Range | 41.3% | 74.7% |
| Mean | 48.6% | 52.8% |
| Median | 48.0% | 53.4% |
| Interquartile 25% (IQ1) | 43.8% | 47.9% |
| Interquartile 75% (IQ3) | 55.3% | 59.7% |
| Interquartile Range (IQR) | 11.5% | 11.8% |
| Standard Deviation (Sample) | 8.3% | 12.1% |
| Standard Deviation (Population) | 8.2% | 12.0% |
Similar Demographics by Currently Married
Demographics Similar to Carpatho Rusyns by Currently Married
In terms of currently married, the demographic groups most similar to Carpatho Rusyns are Immigrants from South Eastern Asia (47.1%, a difference of 0.010%), Immigrants from Argentina (47.0%, a difference of 0.030%), Hmong (47.1%, a difference of 0.040%), Guamanian/Chamorro (47.1%, a difference of 0.070%), and Venezuelan (47.1%, a difference of 0.080%).
| Demographics | Rating | Rank | Currently Married |
| Yugoslavians | 77.4 /100 | #139 | Good 47.2% |
| Cajuns | 75.3 /100 | #140 | Good 47.1% |
| Venezuelans | 74.4 /100 | #141 | Good 47.1% |
| Argentineans | 74.4 /100 | #142 | Good 47.1% |
| Guamanians/Chamorros | 74.2 /100 | #143 | Good 47.1% |
| Hmong | 73.4 /100 | #144 | Good 47.1% |
| Immigrants | South Eastern Asia | 72.9 /100 | #145 | Good 47.1% |
| Carpatho Rusyns | 72.6 /100 | #146 | Good 47.0% |
| Immigrants | Argentina | 72.0 /100 | #147 | Good 47.0% |
| Cambodians | 70.4 /100 | #148 | Good 47.0% |
| Zimbabweans | 70.1 /100 | #149 | Good 47.0% |
| Immigrants | Turkey | 70.0 /100 | #150 | Good 47.0% |
| Chileans | 69.8 /100 | #151 | Good 47.0% |
| Immigrants | Serbia | 68.8 /100 | #152 | Good 47.0% |
| Immigrants | Venezuela | 68.6 /100 | #153 | Good 47.0% |
Demographics Similar to Latvians by Currently Married
In terms of currently married, the demographic groups most similar to Latvians are Immigrants from Moldova (48.5%, a difference of 0.0%), Immigrants from North Macedonia (48.5%, a difference of 0.0%), Immigrants from Netherlands (48.5%, a difference of 0.030%), Immigrants from Austria (48.5%, a difference of 0.070%), and French (48.4%, a difference of 0.070%).
| Demographics | Rating | Rank | Currently Married |
| Bhutanese | 99.1 /100 | #49 | Exceptional 48.6% |
| Iranians | 99.0 /100 | #50 | Exceptional 48.6% |
| Whites/Caucasians | 99.0 /100 | #51 | Exceptional 48.6% |
| Russians | 98.9 /100 | #52 | Exceptional 48.6% |
| Immigrants | Austria | 98.8 /100 | #53 | Exceptional 48.5% |
| Immigrants | Moldova | 98.7 /100 | #54 | Exceptional 48.5% |
| Immigrants | North Macedonia | 98.7 /100 | #55 | Exceptional 48.5% |
| Latvians | 98.7 /100 | #56 | Exceptional 48.5% |
| Immigrants | Netherlands | 98.6 /100 | #57 | Exceptional 48.5% |
| French | 98.6 /100 | #58 | Exceptional 48.4% |
| Immigrants | Ireland | 98.5 /100 | #59 | Exceptional 48.4% |
| Immigrants | Romania | 98.5 /100 | #60 | Exceptional 48.4% |
| Romanians | 98.5 /100 | #61 | Exceptional 48.4% |
| Asians | 98.5 /100 | #62 | Exceptional 48.4% |
| Slavs | 98.3 /100 | #63 | Exceptional 48.4% |