Immigrants from Caribbean vs Syrian Currently Married
COMPARE
Immigrants from Caribbean
Syrian
Currently Married
Currently Married Comparison
Immigrants from Caribbean
Syrians
41.3%
CURRENTLY MARRIED
0.0/ 100
METRIC RATING
316th/ 347
METRIC RANK
47.5%
CURRENTLY MARRIED
88.9/ 100
METRIC RATING
120th/ 347
METRIC RANK
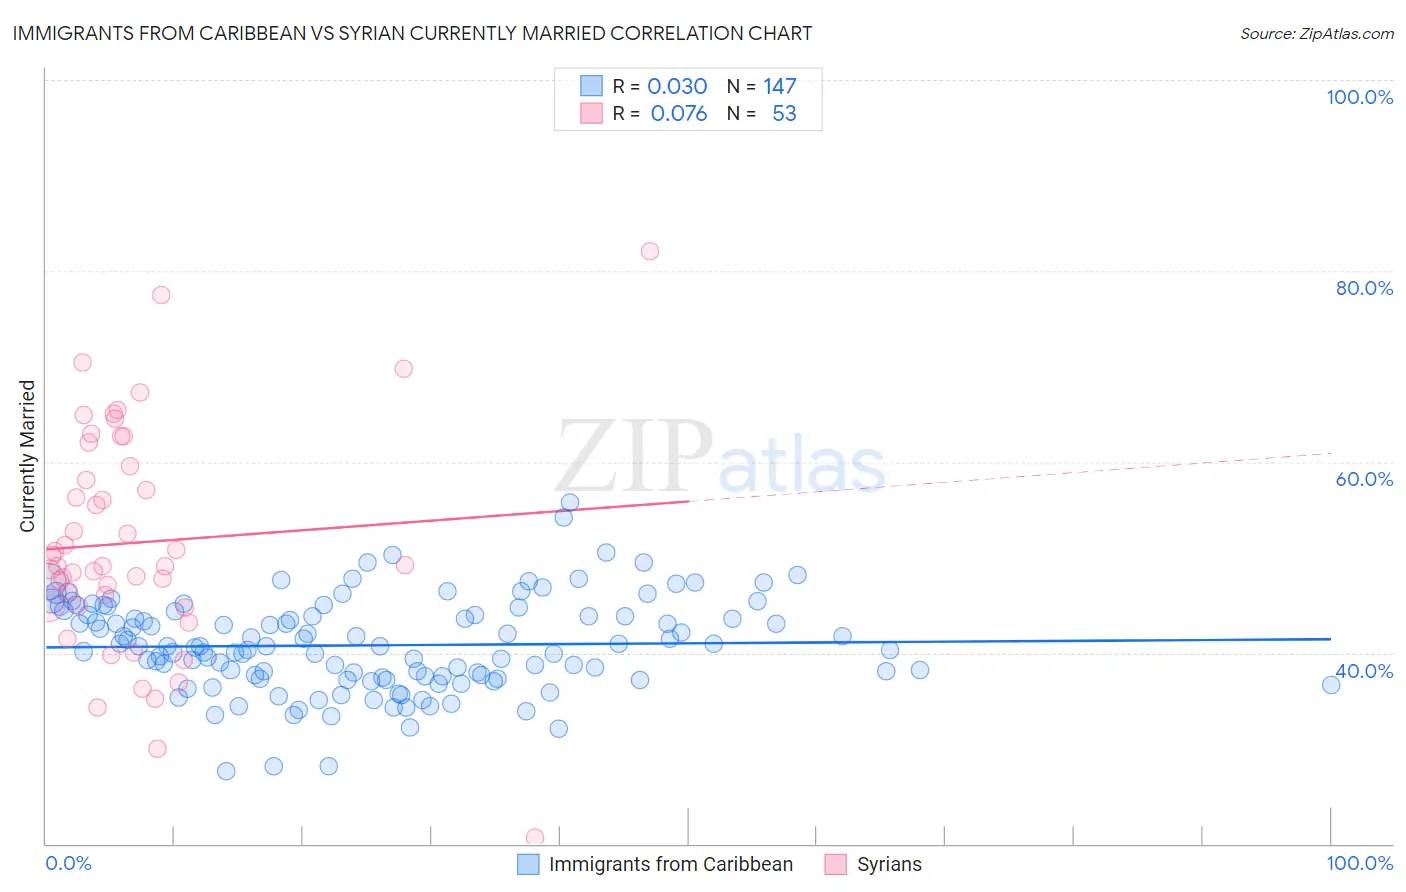
Immigrants from Caribbean vs Syrian Currently Married Correlation Chart
The statistical analysis conducted on geographies consisting of 450,001,379 people shows no correlation between the proportion of Immigrants from Caribbean and percentage of population currently married in the United States with a correlation coefficient (R) of 0.030 and weighted average of 41.3%. Similarly, the statistical analysis conducted on geographies consisting of 266,298,061 people shows a slight positive correlation between the proportion of Syrians and percentage of population currently married in the United States with a correlation coefficient (R) of 0.076 and weighted average of 47.5%, a difference of 15.2%.
Currently Married Correlation Summary
| Measurement | Immigrants from Caribbean | Syrian |
| Minimum | 27.6% | 20.6% |
| Maximum | 55.8% | 82.1% |
| Range | 28.2% | 61.5% |
| Mean | 40.8% | 51.6% |
| Median | 40.7% | 49.1% |
| Interquartile 25% (IQ1) | 37.3% | 45.0% |
| Interquartile 75% (IQ3) | 43.9% | 60.8% |
| Interquartile Range (IQR) | 6.6% | 15.7% |
| Standard Deviation (Sample) | 4.9% | 11.8% |
| Standard Deviation (Population) | 4.9% | 11.7% |
Similar Demographics by Currently Married
Demographics Similar to Immigrants from Caribbean by Currently Married
In terms of currently married, the demographic groups most similar to Immigrants from Caribbean are Haitian (41.3%, a difference of 0.020%), Inupiat (41.3%, a difference of 0.060%), West Indian (41.3%, a difference of 0.15%), Bahamian (41.2%, a difference of 0.20%), and Jamaican (41.4%, a difference of 0.22%).
| Demographics | Rating | Rank | Currently Married |
| Immigrants | Liberia | 0.0 /100 | #309 | Tragic 41.8% |
| Guyanese | 0.0 /100 | #310 | Tragic 41.6% |
| Trinidadians and Tobagonians | 0.0 /100 | #311 | Tragic 41.5% |
| Somalis | 0.0 /100 | #312 | Tragic 41.5% |
| Jamaicans | 0.0 /100 | #313 | Tragic 41.4% |
| West Indians | 0.0 /100 | #314 | Tragic 41.3% |
| Inupiat | 0.0 /100 | #315 | Tragic 41.3% |
| Immigrants | Caribbean | 0.0 /100 | #316 | Tragic 41.3% |
| Haitians | 0.0 /100 | #317 | Tragic 41.3% |
| Bahamians | 0.0 /100 | #318 | Tragic 41.2% |
| Immigrants | Somalia | 0.0 /100 | #319 | Tragic 41.2% |
| Immigrants | Jamaica | 0.0 /100 | #320 | Tragic 41.1% |
| Immigrants | Congo | 0.0 /100 | #321 | Tragic 41.1% |
| Immigrants | Haiti | 0.0 /100 | #322 | Tragic 41.0% |
| Immigrants | West Indies | 0.0 /100 | #323 | Tragic 40.7% |
Demographics Similar to Syrians by Currently Married
In terms of currently married, the demographic groups most similar to Syrians are Immigrants from Croatia (47.5%, a difference of 0.030%), Osage (47.5%, a difference of 0.090%), Immigrants from Philippines (47.6%, a difference of 0.12%), Australian (47.6%, a difference of 0.12%), and Puget Sound Salish (47.6%, a difference of 0.13%).
| Demographics | Rating | Rank | Currently Married |
| Immigrants | Denmark | 90.9 /100 | #113 | Exceptional 47.6% |
| South Africans | 90.5 /100 | #114 | Exceptional 47.6% |
| Immigrants | Indonesia | 90.5 /100 | #115 | Exceptional 47.6% |
| Palestinians | 90.4 /100 | #116 | Exceptional 47.6% |
| Puget Sound Salish | 90.3 /100 | #117 | Exceptional 47.6% |
| Immigrants | Philippines | 90.2 /100 | #118 | Exceptional 47.6% |
| Australians | 90.2 /100 | #119 | Exceptional 47.6% |
| Syrians | 88.9 /100 | #120 | Excellent 47.5% |
| Immigrants | Croatia | 88.6 /100 | #121 | Excellent 47.5% |
| Osage | 87.9 /100 | #122 | Excellent 47.5% |
| Immigrants | Kazakhstan | 87.2 /100 | #123 | Excellent 47.4% |
| Laotians | 86.6 /100 | #124 | Excellent 47.4% |
| Okinawans | 85.3 /100 | #125 | Excellent 47.4% |
| Immigrants | Jordan | 84.9 /100 | #126 | Excellent 47.4% |
| New Zealanders | 84.9 /100 | #127 | Excellent 47.4% |