Colville vs Latvian Currently Married
COMPARE
Colville
Latvian
Currently Married
Currently Married Comparison
Colville
Latvians
43.4%
CURRENTLY MARRIED
0.1/ 100
METRIC RATING
275th/ 347
METRIC RANK
48.5%
CURRENTLY MARRIED
98.7/ 100
METRIC RATING
56th/ 347
METRIC RANK
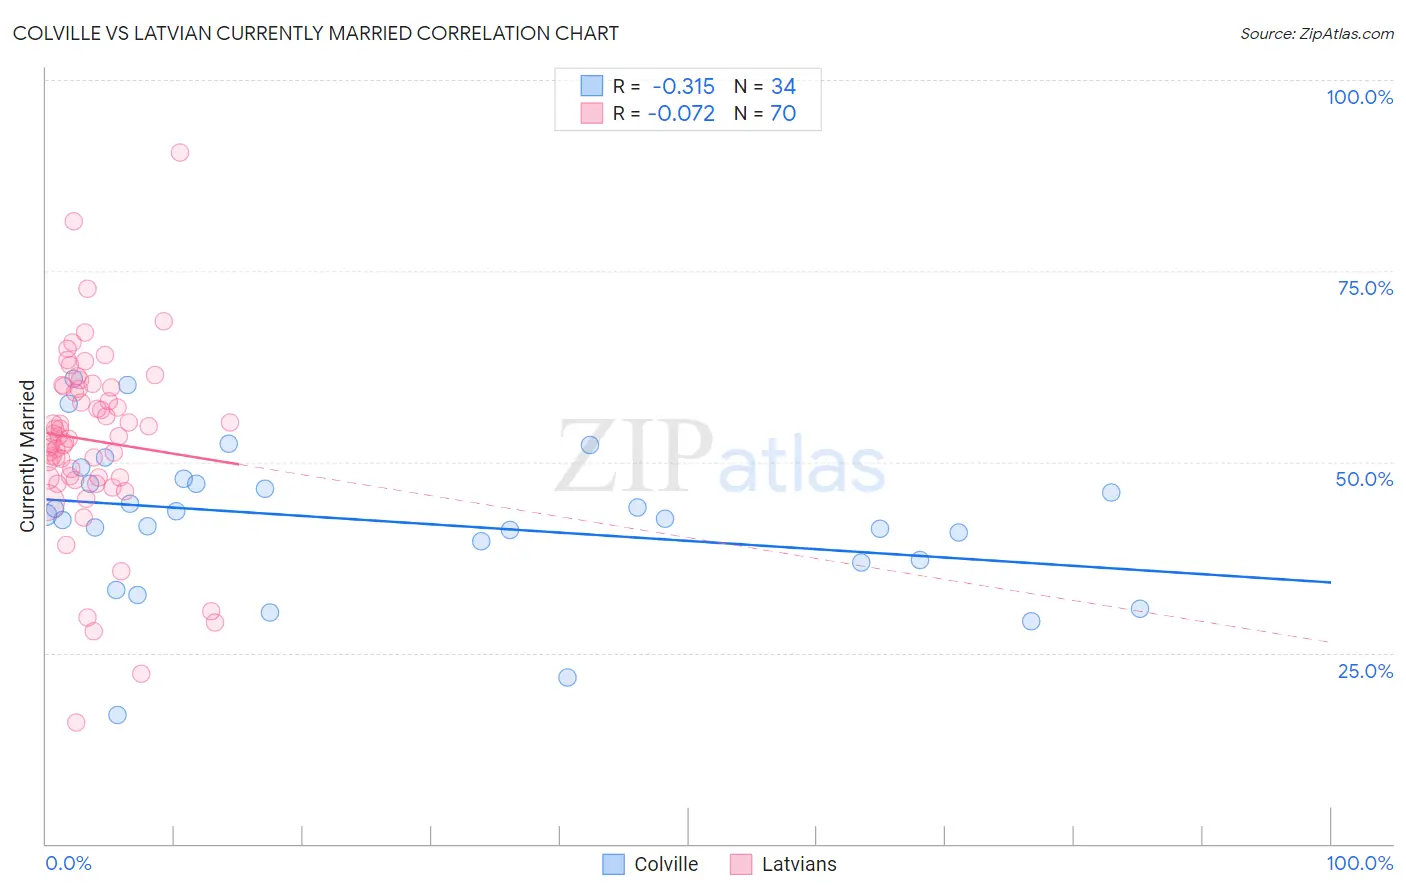
Colville vs Latvian Currently Married Correlation Chart
The statistical analysis conducted on geographies consisting of 34,682,856 people shows a mild negative correlation between the proportion of Colville and percentage of population currently married in the United States with a correlation coefficient (R) of -0.315 and weighted average of 43.4%. Similarly, the statistical analysis conducted on geographies consisting of 220,695,418 people shows a slight negative correlation between the proportion of Latvians and percentage of population currently married in the United States with a correlation coefficient (R) of -0.072 and weighted average of 48.5%, a difference of 11.6%.
Currently Married Correlation Summary
| Measurement | Colville | Latvian |
| Minimum | 16.9% | 15.8% |
| Maximum | 60.9% | 90.5% |
| Range | 44.0% | 74.7% |
| Mean | 42.2% | 52.8% |
| Median | 42.8% | 53.4% |
| Interquartile 25% (IQ1) | 37.2% | 47.9% |
| Interquartile 75% (IQ3) | 47.1% | 59.7% |
| Interquartile Range (IQR) | 9.9% | 11.8% |
| Standard Deviation (Sample) | 9.7% | 12.1% |
| Standard Deviation (Population) | 9.5% | 12.0% |
Similar Demographics by Currently Married
Demographics Similar to Colville by Currently Married
In terms of currently married, the demographic groups most similar to Colville are Nigerian (43.4%, a difference of 0.020%), Sierra Leonean (43.4%, a difference of 0.030%), Yaqui (43.4%, a difference of 0.040%), Immigrants from Nigeria (43.4%, a difference of 0.040%), and Indonesian (43.5%, a difference of 0.080%).
| Demographics | Rating | Rank | Currently Married |
| Spanish American Indians | 0.1 /100 | #268 | Tragic 43.6% |
| Immigrants | Sudan | 0.1 /100 | #269 | Tragic 43.5% |
| Salvadorans | 0.1 /100 | #270 | Tragic 43.5% |
| Bermudans | 0.1 /100 | #271 | Tragic 43.5% |
| Indonesians | 0.1 /100 | #272 | Tragic 43.5% |
| Yaqui | 0.1 /100 | #273 | Tragic 43.4% |
| Nigerians | 0.1 /100 | #274 | Tragic 43.4% |
| Colville | 0.1 /100 | #275 | Tragic 43.4% |
| Sierra Leoneans | 0.1 /100 | #276 | Tragic 43.4% |
| Immigrants | Nigeria | 0.1 /100 | #277 | Tragic 43.4% |
| Central Americans | 0.0 /100 | #278 | Tragic 43.3% |
| Central American Indians | 0.0 /100 | #279 | Tragic 43.3% |
| Apache | 0.0 /100 | #280 | Tragic 43.2% |
| Chippewa | 0.0 /100 | #281 | Tragic 43.2% |
| Immigrants | Ecuador | 0.0 /100 | #282 | Tragic 43.2% |
Demographics Similar to Latvians by Currently Married
In terms of currently married, the demographic groups most similar to Latvians are Immigrants from Moldova (48.5%, a difference of 0.0%), Immigrants from North Macedonia (48.5%, a difference of 0.0%), Immigrants from Netherlands (48.5%, a difference of 0.030%), Immigrants from Austria (48.5%, a difference of 0.070%), and French (48.4%, a difference of 0.070%).
| Demographics | Rating | Rank | Currently Married |
| Bhutanese | 99.1 /100 | #49 | Exceptional 48.6% |
| Iranians | 99.0 /100 | #50 | Exceptional 48.6% |
| Whites/Caucasians | 99.0 /100 | #51 | Exceptional 48.6% |
| Russians | 98.9 /100 | #52 | Exceptional 48.6% |
| Immigrants | Austria | 98.8 /100 | #53 | Exceptional 48.5% |
| Immigrants | Moldova | 98.7 /100 | #54 | Exceptional 48.5% |
| Immigrants | North Macedonia | 98.7 /100 | #55 | Exceptional 48.5% |
| Latvians | 98.7 /100 | #56 | Exceptional 48.5% |
| Immigrants | Netherlands | 98.6 /100 | #57 | Exceptional 48.5% |
| French | 98.6 /100 | #58 | Exceptional 48.4% |
| Immigrants | Ireland | 98.5 /100 | #59 | Exceptional 48.4% |
| Immigrants | Romania | 98.5 /100 | #60 | Exceptional 48.4% |
| Romanians | 98.5 /100 | #61 | Exceptional 48.4% |
| Asians | 98.5 /100 | #62 | Exceptional 48.4% |
| Slavs | 98.3 /100 | #63 | Exceptional 48.4% |