Immigrants from Brazil vs Latvian Currently Married
COMPARE
Immigrants from Brazil
Latvian
Currently Married
Currently Married Comparison
Immigrants from Brazil
Latvians
46.6%
CURRENTLY MARRIED
49.9/ 100
METRIC RATING
175th/ 347
METRIC RANK
48.5%
CURRENTLY MARRIED
98.7/ 100
METRIC RATING
56th/ 347
METRIC RANK
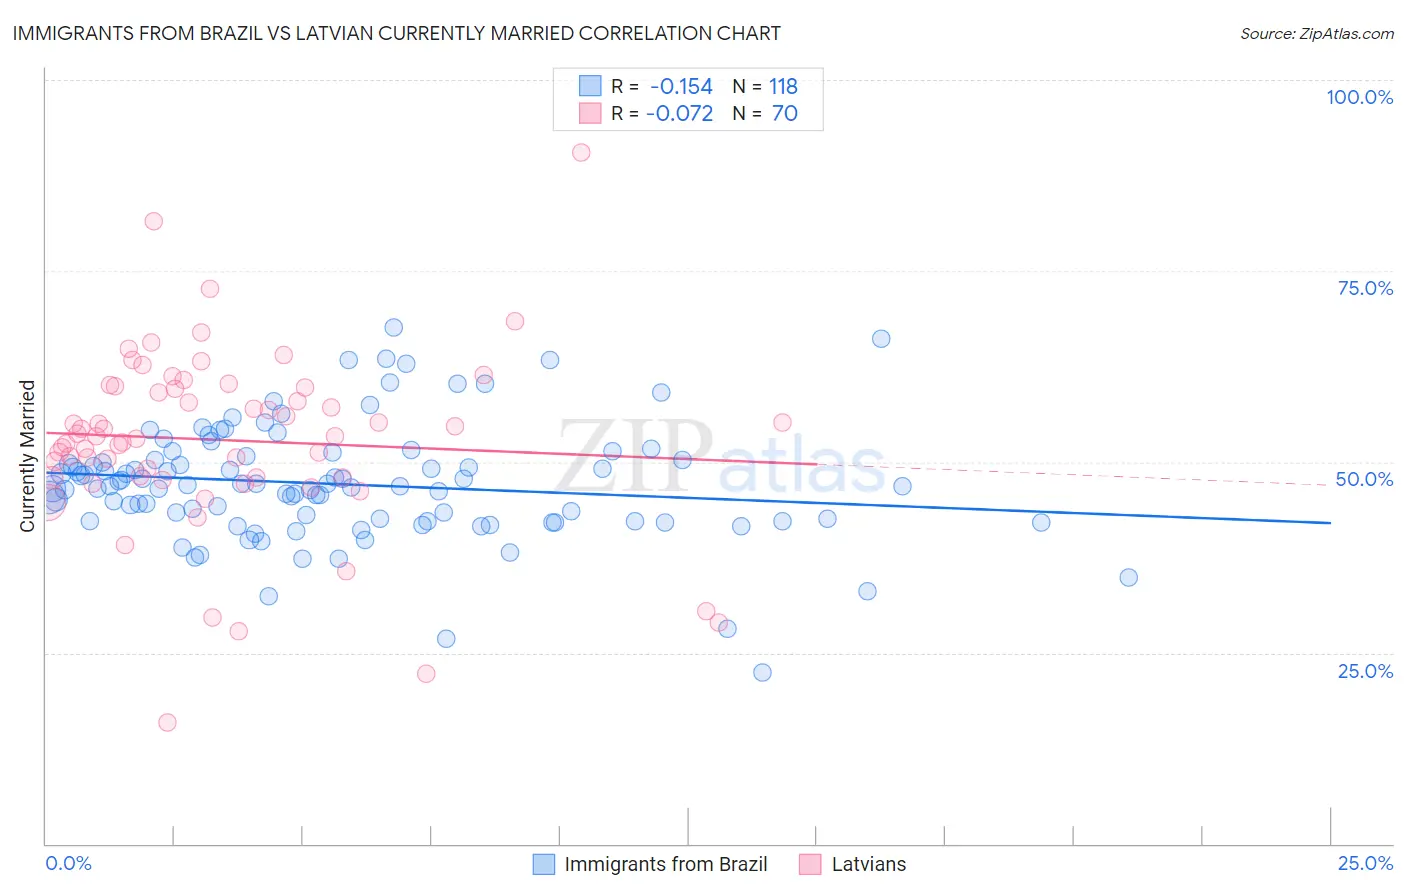
Immigrants from Brazil vs Latvian Currently Married Correlation Chart
The statistical analysis conducted on geographies consisting of 342,973,445 people shows a poor negative correlation between the proportion of Immigrants from Brazil and percentage of population currently married in the United States with a correlation coefficient (R) of -0.154 and weighted average of 46.6%. Similarly, the statistical analysis conducted on geographies consisting of 220,695,418 people shows a slight negative correlation between the proportion of Latvians and percentage of population currently married in the United States with a correlation coefficient (R) of -0.072 and weighted average of 48.5%, a difference of 4.0%.
Currently Married Correlation Summary
| Measurement | Immigrants from Brazil | Latvian |
| Minimum | 22.4% | 15.8% |
| Maximum | 67.6% | 90.5% |
| Range | 45.2% | 74.7% |
| Mean | 47.1% | 52.8% |
| Median | 46.8% | 53.4% |
| Interquartile 25% (IQ1) | 42.3% | 47.9% |
| Interquartile 75% (IQ3) | 50.3% | 59.7% |
| Interquartile Range (IQR) | 8.0% | 11.8% |
| Standard Deviation (Sample) | 7.6% | 12.1% |
| Standard Deviation (Population) | 7.6% | 12.0% |
Similar Demographics by Currently Married
Demographics Similar to Immigrants from Brazil by Currently Married
In terms of currently married, the demographic groups most similar to Immigrants from Brazil are Peruvian (46.6%, a difference of 0.010%), Tlingit-Haida (46.7%, a difference of 0.050%), Hawaiian (46.6%, a difference of 0.050%), Israeli (46.6%, a difference of 0.050%), and Chickasaw (46.6%, a difference of 0.070%).
| Demographics | Rating | Rank | Currently Married |
| Immigrants | Afghanistan | 58.2 /100 | #168 | Average 46.8% |
| Armenians | 58.2 /100 | #169 | Average 46.8% |
| Immigrants | Latvia | 56.7 /100 | #170 | Average 46.7% |
| Immigrants | Zimbabwe | 52.4 /100 | #171 | Average 46.7% |
| Aleuts | 52.0 /100 | #172 | Average 46.7% |
| Tlingit-Haida | 51.2 /100 | #173 | Average 46.7% |
| Peruvians | 50.0 /100 | #174 | Average 46.6% |
| Immigrants | Brazil | 49.9 /100 | #175 | Average 46.6% |
| Hawaiians | 48.6 /100 | #176 | Average 46.6% |
| Israelis | 48.6 /100 | #177 | Average 46.6% |
| Chickasaw | 47.8 /100 | #178 | Average 46.6% |
| Immigrants | Oceania | 44.6 /100 | #179 | Average 46.5% |
| Costa Ricans | 43.7 /100 | #180 | Average 46.5% |
| Ottawa | 43.0 /100 | #181 | Average 46.5% |
| Potawatomi | 41.9 /100 | #182 | Average 46.5% |
Demographics Similar to Latvians by Currently Married
In terms of currently married, the demographic groups most similar to Latvians are Immigrants from Moldova (48.5%, a difference of 0.0%), Immigrants from North Macedonia (48.5%, a difference of 0.0%), Immigrants from Netherlands (48.5%, a difference of 0.030%), Immigrants from Austria (48.5%, a difference of 0.070%), and French (48.4%, a difference of 0.070%).
| Demographics | Rating | Rank | Currently Married |
| Bhutanese | 99.1 /100 | #49 | Exceptional 48.6% |
| Iranians | 99.0 /100 | #50 | Exceptional 48.6% |
| Whites/Caucasians | 99.0 /100 | #51 | Exceptional 48.6% |
| Russians | 98.9 /100 | #52 | Exceptional 48.6% |
| Immigrants | Austria | 98.8 /100 | #53 | Exceptional 48.5% |
| Immigrants | Moldova | 98.7 /100 | #54 | Exceptional 48.5% |
| Immigrants | North Macedonia | 98.7 /100 | #55 | Exceptional 48.5% |
| Latvians | 98.7 /100 | #56 | Exceptional 48.5% |
| Immigrants | Netherlands | 98.6 /100 | #57 | Exceptional 48.5% |
| French | 98.6 /100 | #58 | Exceptional 48.4% |
| Immigrants | Ireland | 98.5 /100 | #59 | Exceptional 48.4% |
| Immigrants | Romania | 98.5 /100 | #60 | Exceptional 48.4% |
| Romanians | 98.5 /100 | #61 | Exceptional 48.4% |
| Asians | 98.5 /100 | #62 | Exceptional 48.4% |
| Slavs | 98.3 /100 | #63 | Exceptional 48.4% |