Immigrants from Burma/Myanmar vs Liberian Single Mother Households
COMPARE
Immigrants from Burma/Myanmar
Liberian
Single Mother Households
Single Mother Households Comparison
Immigrants from Burma/Myanmar
Liberians
7.0%
SINGLE MOTHER HOUSEHOLDS
1.4/ 100
METRIC RATING
235th/ 347
METRIC RANK
8.6%
SINGLE MOTHER HOUSEHOLDS
0.0/ 100
METRIC RATING
333rd/ 347
METRIC RANK
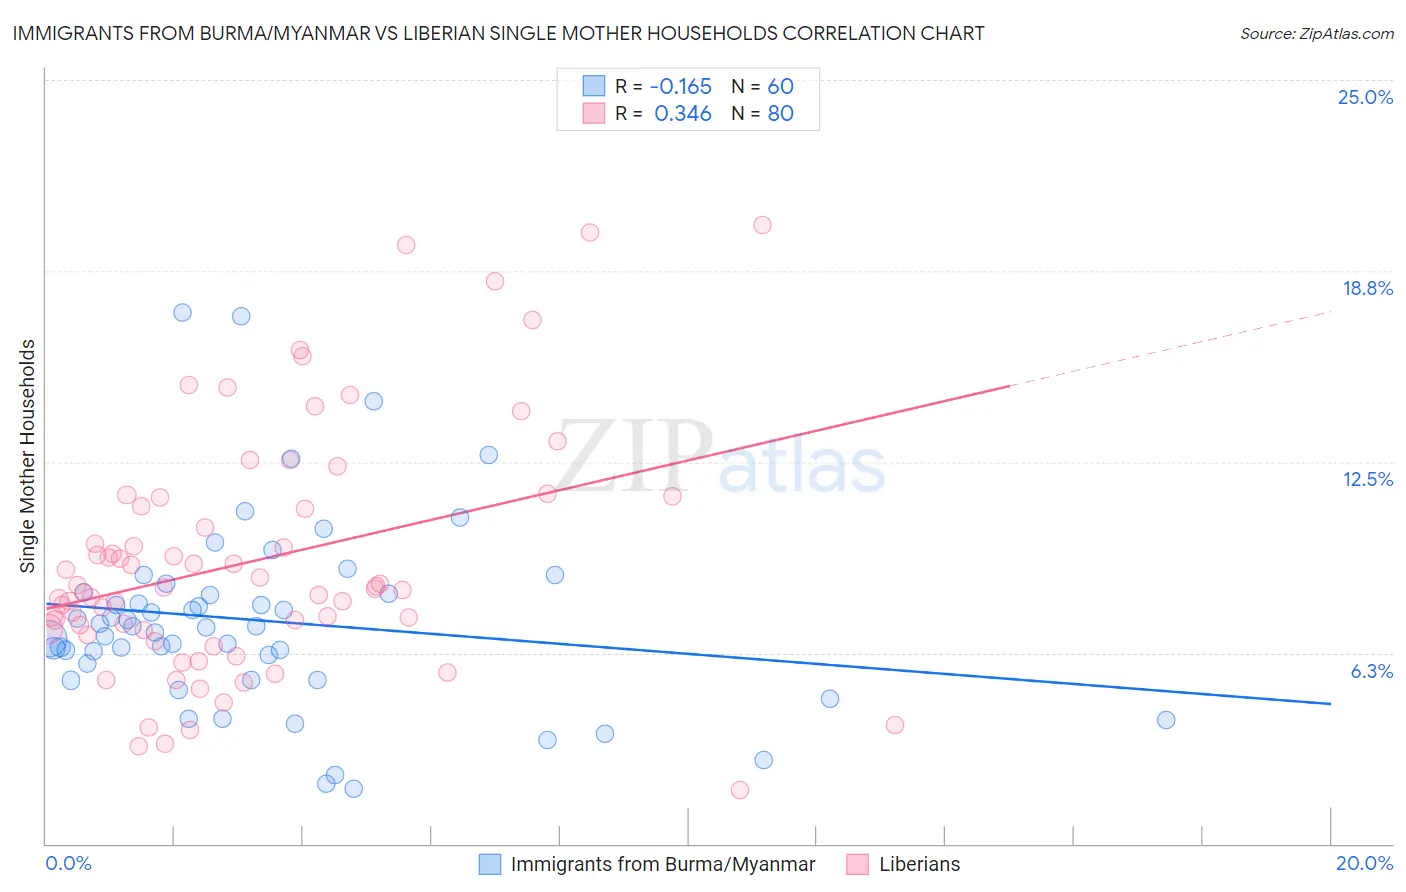
Immigrants from Burma/Myanmar vs Liberian Single Mother Households Correlation Chart
The statistical analysis conducted on geographies consisting of 172,110,214 people shows a poor negative correlation between the proportion of Immigrants from Burma/Myanmar and percentage of single mother households in the United States with a correlation coefficient (R) of -0.165 and weighted average of 7.0%. Similarly, the statistical analysis conducted on geographies consisting of 118,018,313 people shows a mild positive correlation between the proportion of Liberians and percentage of single mother households in the United States with a correlation coefficient (R) of 0.346 and weighted average of 8.6%, a difference of 22.6%.
Single Mother Households Correlation Summary
| Measurement | Immigrants from Burma/Myanmar | Liberian |
| Minimum | 1.8% | 1.7% |
| Maximum | 17.4% | 20.2% |
| Range | 15.6% | 18.5% |
| Mean | 7.3% | 9.3% |
| Median | 7.1% | 8.4% |
| Interquartile 25% (IQ1) | 5.6% | 7.0% |
| Interquartile 75% (IQ3) | 8.2% | 11.2% |
| Interquartile Range (IQR) | 2.6% | 4.2% |
| Standard Deviation (Sample) | 3.1% | 4.0% |
| Standard Deviation (Population) | 3.1% | 3.9% |
Similar Demographics by Single Mother Households
Demographics Similar to Immigrants from Burma/Myanmar by Single Mother Households
In terms of single mother households, the demographic groups most similar to Immigrants from Burma/Myanmar are Chickasaw (7.0%, a difference of 0.070%), Choctaw (7.0%, a difference of 0.090%), Comanche (7.0%, a difference of 0.26%), Spanish American (7.0%, a difference of 0.32%), and Creek (7.0%, a difference of 0.34%).
| Demographics | Rating | Rank | Single Mother Households |
| Iroquois | 2.2 /100 | #228 | Tragic 7.0% |
| Immigrants | Kenya | 2.1 /100 | #229 | Tragic 7.0% |
| Creek | 1.6 /100 | #230 | Tragic 7.0% |
| Spanish Americans | 1.6 /100 | #231 | Tragic 7.0% |
| Comanche | 1.5 /100 | #232 | Tragic 7.0% |
| Choctaw | 1.4 /100 | #233 | Tragic 7.0% |
| Chickasaw | 1.4 /100 | #234 | Tragic 7.0% |
| Immigrants | Burma/Myanmar | 1.4 /100 | #235 | Tragic 7.0% |
| Ute | 1.0 /100 | #236 | Tragic 7.1% |
| Arapaho | 1.0 /100 | #237 | Tragic 7.1% |
| Panamanians | 0.9 /100 | #238 | Tragic 7.1% |
| Kiowa | 0.8 /100 | #239 | Tragic 7.1% |
| Immigrants | Panama | 0.7 /100 | #240 | Tragic 7.2% |
| Immigrants | Portugal | 0.6 /100 | #241 | Tragic 7.2% |
| Fijians | 0.6 /100 | #242 | Tragic 7.2% |
Demographics Similar to Liberians by Single Mother Households
In terms of single mother households, the demographic groups most similar to Liberians are U.S. Virgin Islander (8.6%, a difference of 0.33%), Immigrants from Liberia (8.7%, a difference of 0.80%), Immigrants from Dominica (8.7%, a difference of 1.1%), Puerto Rican (8.7%, a difference of 1.1%), and Inupiat (8.5%, a difference of 1.8%).
| Demographics | Rating | Rank | Single Mother Households |
| British West Indians | 0.0 /100 | #326 | Tragic 8.4% |
| Immigrants | Haiti | 0.0 /100 | #327 | Tragic 8.4% |
| Yakama | 0.0 /100 | #328 | Tragic 8.4% |
| Hopi | 0.0 /100 | #329 | Tragic 8.5% |
| Inupiat | 0.0 /100 | #330 | Tragic 8.5% |
| Sioux | 0.0 /100 | #331 | Tragic 8.5% |
| U.S. Virgin Islanders | 0.0 /100 | #332 | Tragic 8.6% |
| Liberians | 0.0 /100 | #333 | Tragic 8.6% |
| Immigrants | Liberia | 0.0 /100 | #334 | Tragic 8.7% |
| Immigrants | Dominica | 0.0 /100 | #335 | Tragic 8.7% |
| Puerto Ricans | 0.0 /100 | #336 | Tragic 8.7% |
| Navajo | 0.0 /100 | #337 | Tragic 8.8% |
| Cape Verdeans | 0.0 /100 | #338 | Tragic 8.9% |
| Blacks/African Americans | 0.0 /100 | #339 | Tragic 9.0% |
| Lumbee | 0.0 /100 | #340 | Tragic 9.1% |