Immigrants from Burma/Myanmar vs Aleut Single Mother Households
COMPARE
Immigrants from Burma/Myanmar
Aleut
Single Mother Households
Single Mother Households Comparison
Immigrants from Burma/Myanmar
Aleuts
7.0%
SINGLE MOTHER HOUSEHOLDS
1.4/ 100
METRIC RATING
235th/ 347
METRIC RANK
6.8%
SINGLE MOTHER HOUSEHOLDS
4.8/ 100
METRIC RATING
217th/ 347
METRIC RANK
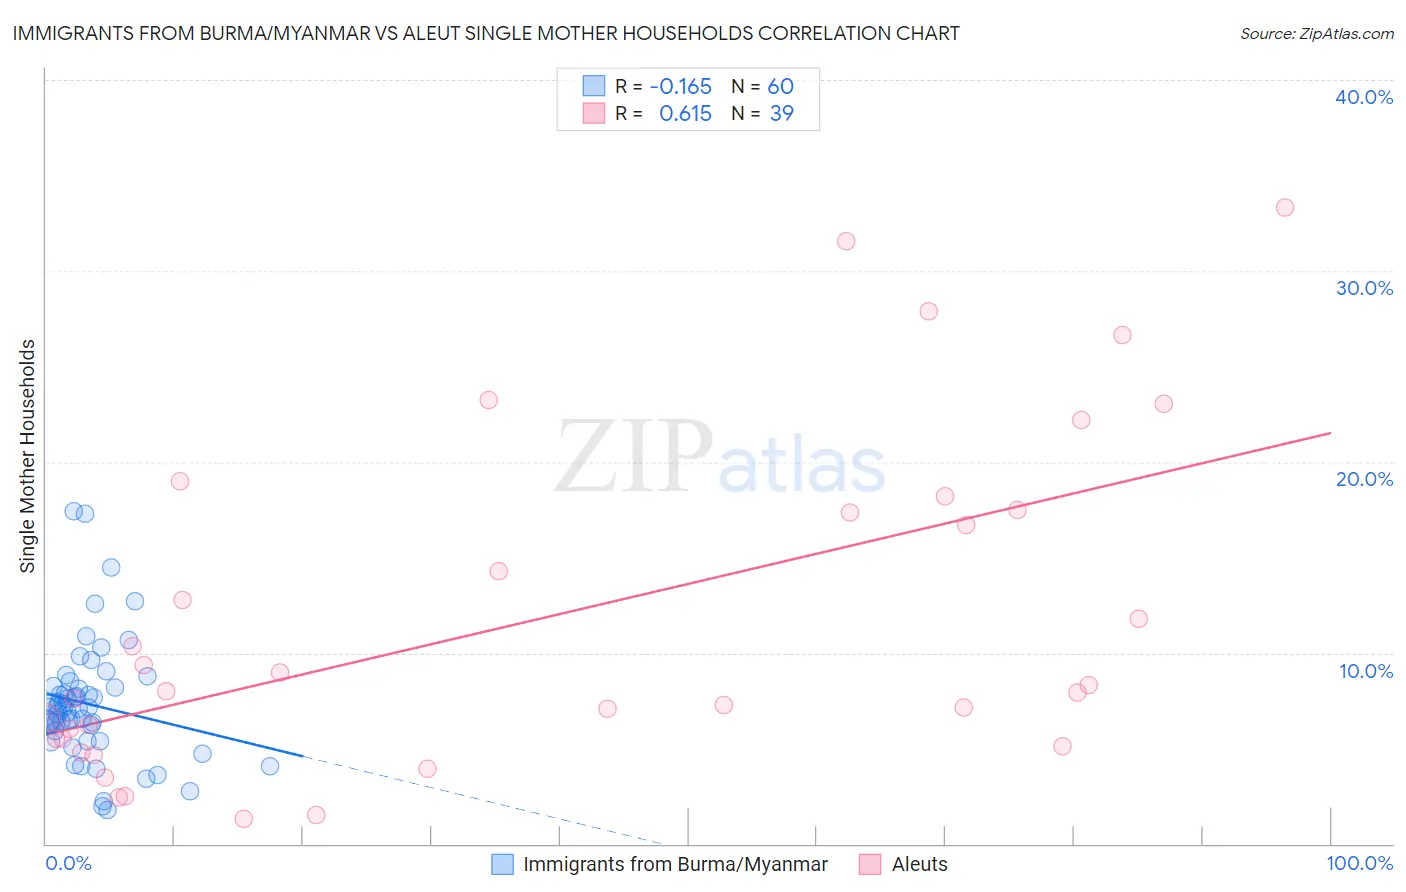
Immigrants from Burma/Myanmar vs Aleut Single Mother Households Correlation Chart
The statistical analysis conducted on geographies consisting of 172,110,214 people shows a poor negative correlation between the proportion of Immigrants from Burma/Myanmar and percentage of single mother households in the United States with a correlation coefficient (R) of -0.165 and weighted average of 7.0%. Similarly, the statistical analysis conducted on geographies consisting of 61,699,549 people shows a significant positive correlation between the proportion of Aleuts and percentage of single mother households in the United States with a correlation coefficient (R) of 0.615 and weighted average of 6.8%, a difference of 3.3%.
Single Mother Households Correlation Summary
| Measurement | Immigrants from Burma/Myanmar | Aleut |
| Minimum | 1.8% | 1.3% |
| Maximum | 17.4% | 33.3% |
| Range | 15.6% | 32.0% |
| Mean | 7.3% | 11.7% |
| Median | 7.1% | 8.0% |
| Interquartile 25% (IQ1) | 5.6% | 5.5% |
| Interquartile 75% (IQ3) | 8.2% | 17.5% |
| Interquartile Range (IQR) | 2.6% | 12.0% |
| Standard Deviation (Sample) | 3.1% | 8.7% |
| Standard Deviation (Population) | 3.1% | 8.6% |
Demographics Similar to Immigrants from Burma/Myanmar and Aleuts by Single Mother Households
In terms of single mother households, the demographic groups most similar to Immigrants from Burma/Myanmar are Chickasaw (7.0%, a difference of 0.070%), Choctaw (7.0%, a difference of 0.090%), Comanche (7.0%, a difference of 0.26%), Spanish American (7.0%, a difference of 0.32%), and Creek (7.0%, a difference of 0.34%). Similarly, the demographic groups most similar to Aleuts are Cherokee (6.8%, a difference of 0.14%), Immigrants from Eastern Africa (6.8%, a difference of 0.21%), Immigrants (6.8%, a difference of 0.30%), Immigrants from Thailand (6.9%, a difference of 0.49%), and French American Indian (6.9%, a difference of 0.68%).
| Demographics | Rating | Rank | Single Mother Households |
| Cherokee | 5.1 /100 | #216 | Tragic 6.8% |
| Aleuts | 4.8 /100 | #217 | Tragic 6.8% |
| Immigrants | Eastern Africa | 4.4 /100 | #218 | Tragic 6.8% |
| Immigrants | Immigrants | 4.3 /100 | #219 | Tragic 6.8% |
| Immigrants | Thailand | 4.0 /100 | #220 | Tragic 6.9% |
| French American Indians | 3.7 /100 | #221 | Tragic 6.9% |
| Immigrants | Bangladesh | 3.7 /100 | #222 | Tragic 6.9% |
| Immigrants | Micronesia | 3.6 /100 | #223 | Tragic 6.9% |
| Immigrants | Sudan | 3.5 /100 | #224 | Tragic 6.9% |
| Sudanese | 3.1 /100 | #225 | Tragic 6.9% |
| Paiute | 2.4 /100 | #226 | Tragic 7.0% |
| Kenyans | 2.3 /100 | #227 | Tragic 7.0% |
| Iroquois | 2.2 /100 | #228 | Tragic 7.0% |
| Immigrants | Kenya | 2.1 /100 | #229 | Tragic 7.0% |
| Creek | 1.6 /100 | #230 | Tragic 7.0% |
| Spanish Americans | 1.6 /100 | #231 | Tragic 7.0% |
| Comanche | 1.5 /100 | #232 | Tragic 7.0% |
| Choctaw | 1.4 /100 | #233 | Tragic 7.0% |
| Chickasaw | 1.4 /100 | #234 | Tragic 7.0% |
| Immigrants | Burma/Myanmar | 1.4 /100 | #235 | Tragic 7.0% |
| Ute | 1.0 /100 | #236 | Tragic 7.1% |