Immigrants from Burma/Myanmar vs Blackfeet Average Family Size
COMPARE
Immigrants from Burma/Myanmar
Blackfeet
Average Family Size
Average Family Size Comparison
Immigrants from Burma/Myanmar
Blackfeet
3.29
AVERAGE FAMILY SIZE
98.6/ 100
METRIC RATING
101st/ 347
METRIC RANK
3.24
AVERAGE FAMILY SIZE
75.0/ 100
METRIC RATING
148th/ 347
METRIC RANK
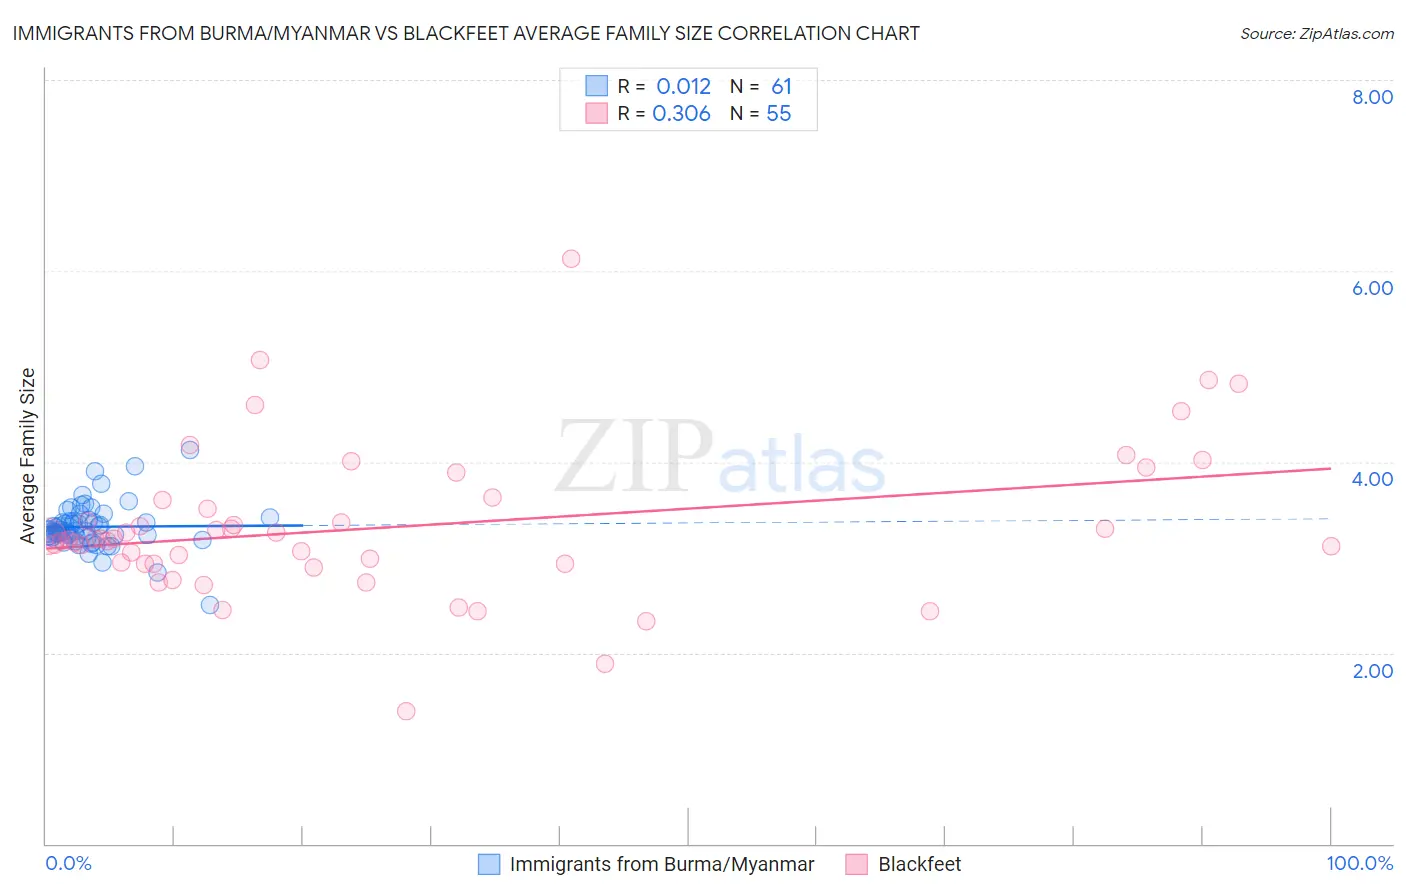
Immigrants from Burma/Myanmar vs Blackfeet Average Family Size Correlation Chart
The statistical analysis conducted on geographies consisting of 172,260,665 people shows no correlation between the proportion of Immigrants from Burma/Myanmar and average family size in the United States with a correlation coefficient (R) of 0.012 and weighted average of 3.29. Similarly, the statistical analysis conducted on geographies consisting of 309,476,508 people shows a mild positive correlation between the proportion of Blackfeet and average family size in the United States with a correlation coefficient (R) of 0.306 and weighted average of 3.24, a difference of 1.4%.
Average Family Size Correlation Summary
| Measurement | Immigrants from Burma/Myanmar | Blackfeet |
| Minimum | 2.50 | 1.39 |
| Maximum | 4.13 | 6.13 |
| Range | 1.63 | 4.74 |
| Mean | 3.32 | 3.32 |
| Median | 3.27 | 3.19 |
| Interquartile 25% (IQ1) | 3.21 | 2.93 |
| Interquartile 75% (IQ3) | 3.39 | 3.60 |
| Interquartile Range (IQR) | 0.17 | 0.67 |
| Standard Deviation (Sample) | 0.25 | 0.80 |
| Standard Deviation (Population) | 0.24 | 0.79 |
Similar Demographics by Average Family Size
Demographics Similar to Immigrants from Burma/Myanmar by Average Family Size
In terms of average family size, the demographic groups most similar to Immigrants from Burma/Myanmar are West Indian (3.29, a difference of 0.010%), Nigerian (3.29, a difference of 0.020%), Guamanian/Chamorro (3.29, a difference of 0.020%), Immigrants from Oceania (3.29, a difference of 0.030%), and Barbadian (3.29, a difference of 0.030%).
| Demographics | Rating | Rank | Average Family Size |
| Sierra Leoneans | 99.0 /100 | #94 | Exceptional 3.30 |
| Immigrants | Lebanon | 99.0 /100 | #95 | Exceptional 3.30 |
| U.S. Virgin Islanders | 98.8 /100 | #96 | Exceptional 3.29 |
| Immigrants | Oceania | 98.7 /100 | #97 | Exceptional 3.29 |
| Barbadians | 98.6 /100 | #98 | Exceptional 3.29 |
| Nigerians | 98.6 /100 | #99 | Exceptional 3.29 |
| Guamanians/Chamorros | 98.6 /100 | #100 | Exceptional 3.29 |
| Immigrants | Burma/Myanmar | 98.6 /100 | #101 | Exceptional 3.29 |
| West Indians | 98.5 /100 | #102 | Exceptional 3.29 |
| Immigrants | Western Africa | 98.4 /100 | #103 | Exceptional 3.29 |
| Bolivians | 98.3 /100 | #104 | Exceptional 3.29 |
| Immigrants | Ghana | 98.1 /100 | #105 | Exceptional 3.29 |
| Paiute | 98.0 /100 | #106 | Exceptional 3.29 |
| Ghanaians | 98.0 /100 | #107 | Exceptional 3.29 |
| Asians | 97.0 /100 | #108 | Exceptional 3.28 |
Demographics Similar to Blackfeet by Average Family Size
In terms of average family size, the demographic groups most similar to Blackfeet are Immigrants from Jordan (3.24, a difference of 0.020%), Assyrian/Chaldean/Syriac (3.24, a difference of 0.030%), Indian (Asian) (3.24, a difference of 0.030%), Jordanian (3.24, a difference of 0.040%), and Spanish American (3.24, a difference of 0.060%).
| Demographics | Rating | Rank | Average Family Size |
| Venezuelans | 81.4 /100 | #141 | Excellent 3.25 |
| Liberians | 81.2 /100 | #142 | Excellent 3.25 |
| Bhutanese | 81.0 /100 | #143 | Excellent 3.25 |
| Tsimshian | 80.2 /100 | #144 | Excellent 3.25 |
| Armenians | 78.2 /100 | #145 | Good 3.25 |
| Immigrants | Africa | 77.9 /100 | #146 | Good 3.25 |
| Immigrants | Jordan | 75.7 /100 | #147 | Good 3.24 |
| Blackfeet | 75.0 /100 | #148 | Good 3.24 |
| Assyrians/Chaldeans/Syriacs | 73.8 /100 | #149 | Good 3.24 |
| Indians (Asian) | 73.6 /100 | #150 | Good 3.24 |
| Jordanians | 73.5 /100 | #151 | Good 3.24 |
| Spanish Americans | 72.5 /100 | #152 | Good 3.24 |
| Immigrants | Eritrea | 71.4 /100 | #153 | Good 3.24 |
| Immigrants | Egypt | 70.0 /100 | #154 | Good 3.24 |
| Seminole | 68.2 /100 | #155 | Good 3.24 |