Immigrants from Burma/Myanmar vs Immigrants from Guatemala Average Family Size
COMPARE
Immigrants from Burma/Myanmar
Immigrants from Guatemala
Average Family Size
Average Family Size Comparison
Immigrants from Burma/Myanmar
Immigrants from Guatemala
3.29
AVERAGE FAMILY SIZE
98.6/ 100
METRIC RATING
101st/ 347
METRIC RANK
3.41
AVERAGE FAMILY SIZE
100.0/ 100
METRIC RATING
32nd/ 347
METRIC RANK
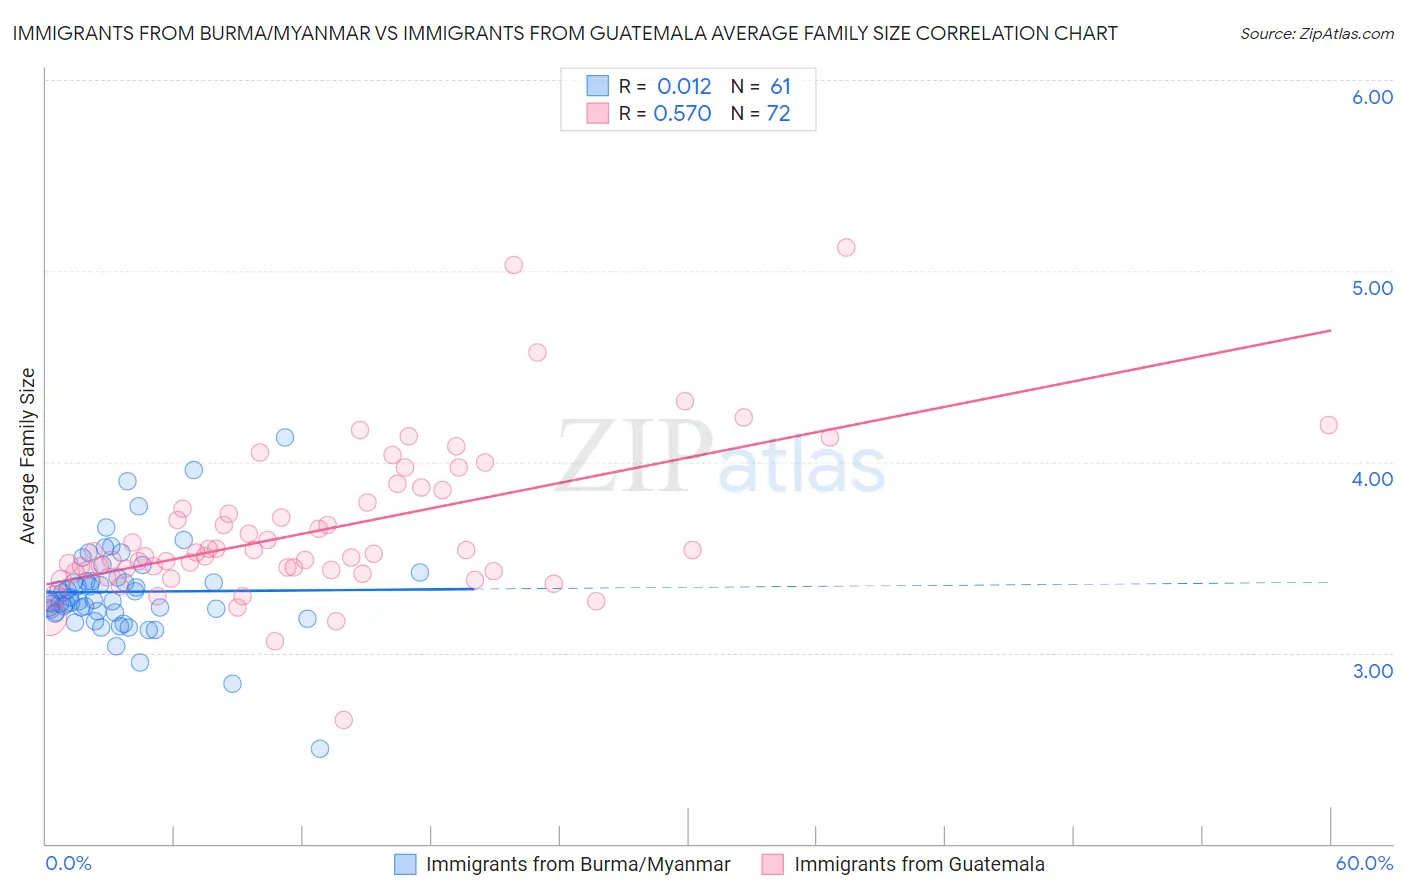
Immigrants from Burma/Myanmar vs Immigrants from Guatemala Average Family Size Correlation Chart
The statistical analysis conducted on geographies consisting of 172,260,665 people shows no correlation between the proportion of Immigrants from Burma/Myanmar and average family size in the United States with a correlation coefficient (R) of 0.012 and weighted average of 3.29. Similarly, the statistical analysis conducted on geographies consisting of 377,174,912 people shows a substantial positive correlation between the proportion of Immigrants from Guatemala and average family size in the United States with a correlation coefficient (R) of 0.570 and weighted average of 3.41, a difference of 3.6%.
Average Family Size Correlation Summary
| Measurement | Immigrants from Burma/Myanmar | Immigrants from Guatemala |
| Minimum | 2.50 | 2.65 |
| Maximum | 4.13 | 5.12 |
| Range | 1.63 | 2.47 |
| Mean | 3.32 | 3.64 |
| Median | 3.27 | 3.52 |
| Interquartile 25% (IQ1) | 3.21 | 3.43 |
| Interquartile 75% (IQ3) | 3.39 | 3.82 |
| Interquartile Range (IQR) | 0.17 | 0.39 |
| Standard Deviation (Sample) | 0.25 | 0.40 |
| Standard Deviation (Population) | 0.24 | 0.40 |
Similar Demographics by Average Family Size
Demographics Similar to Immigrants from Burma/Myanmar by Average Family Size
In terms of average family size, the demographic groups most similar to Immigrants from Burma/Myanmar are West Indian (3.29, a difference of 0.010%), Nigerian (3.29, a difference of 0.020%), Guamanian/Chamorro (3.29, a difference of 0.020%), Immigrants from Oceania (3.29, a difference of 0.030%), and Barbadian (3.29, a difference of 0.030%).
| Demographics | Rating | Rank | Average Family Size |
| Sierra Leoneans | 99.0 /100 | #94 | Exceptional 3.30 |
| Immigrants | Lebanon | 99.0 /100 | #95 | Exceptional 3.30 |
| U.S. Virgin Islanders | 98.8 /100 | #96 | Exceptional 3.29 |
| Immigrants | Oceania | 98.7 /100 | #97 | Exceptional 3.29 |
| Barbadians | 98.6 /100 | #98 | Exceptional 3.29 |
| Nigerians | 98.6 /100 | #99 | Exceptional 3.29 |
| Guamanians/Chamorros | 98.6 /100 | #100 | Exceptional 3.29 |
| Immigrants | Burma/Myanmar | 98.6 /100 | #101 | Exceptional 3.29 |
| West Indians | 98.5 /100 | #102 | Exceptional 3.29 |
| Immigrants | Western Africa | 98.4 /100 | #103 | Exceptional 3.29 |
| Bolivians | 98.3 /100 | #104 | Exceptional 3.29 |
| Immigrants | Ghana | 98.1 /100 | #105 | Exceptional 3.29 |
| Paiute | 98.0 /100 | #106 | Exceptional 3.29 |
| Ghanaians | 98.0 /100 | #107 | Exceptional 3.29 |
| Asians | 97.0 /100 | #108 | Exceptional 3.28 |
Demographics Similar to Immigrants from Guatemala by Average Family Size
In terms of average family size, the demographic groups most similar to Immigrants from Guatemala are Hawaiian (3.41, a difference of 0.030%), Hispanic or Latino (3.41, a difference of 0.080%), Central American (3.41, a difference of 0.10%), Guatemalan (3.40, a difference of 0.14%), and Immigrants from Guyana (3.40, a difference of 0.19%).
| Demographics | Rating | Rank | Average Family Size |
| Yakama | 100.0 /100 | #25 | Exceptional 3.45 |
| Native Hawaiians | 100.0 /100 | #26 | Exceptional 3.43 |
| Mexican American Indians | 100.0 /100 | #27 | Exceptional 3.43 |
| Immigrants | Latin America | 100.0 /100 | #28 | Exceptional 3.42 |
| Nepalese | 100.0 /100 | #29 | Exceptional 3.42 |
| Samoans | 100.0 /100 | #30 | Exceptional 3.42 |
| Central Americans | 100.0 /100 | #31 | Exceptional 3.41 |
| Immigrants | Guatemala | 100.0 /100 | #32 | Exceptional 3.41 |
| Hawaiians | 100.0 /100 | #33 | Exceptional 3.41 |
| Hispanics or Latinos | 100.0 /100 | #34 | Exceptional 3.41 |
| Guatemalans | 100.0 /100 | #35 | Exceptional 3.40 |
| Immigrants | Guyana | 100.0 /100 | #36 | Exceptional 3.40 |
| Guyanese | 100.0 /100 | #37 | Exceptional 3.40 |
| Immigrants | Belize | 100.0 /100 | #38 | Exceptional 3.39 |
| Immigrants | Haiti | 100.0 /100 | #39 | Exceptional 3.39 |