Sierra Leonean vs Basque Births to Unmarried Women
COMPARE
Sierra Leonean
Basque
Births to Unmarried Women
Births to Unmarried Women Comparison
Sierra Leoneans
Basques
34.9%
BIRTHS TO UNMARRIED WOMEN
1.4/ 100
METRIC RATING
239th/ 347
METRIC RANK
29.7%
BIRTHS TO UNMARRIED WOMEN
93.0/ 100
METRIC RATING
112th/ 347
METRIC RANK
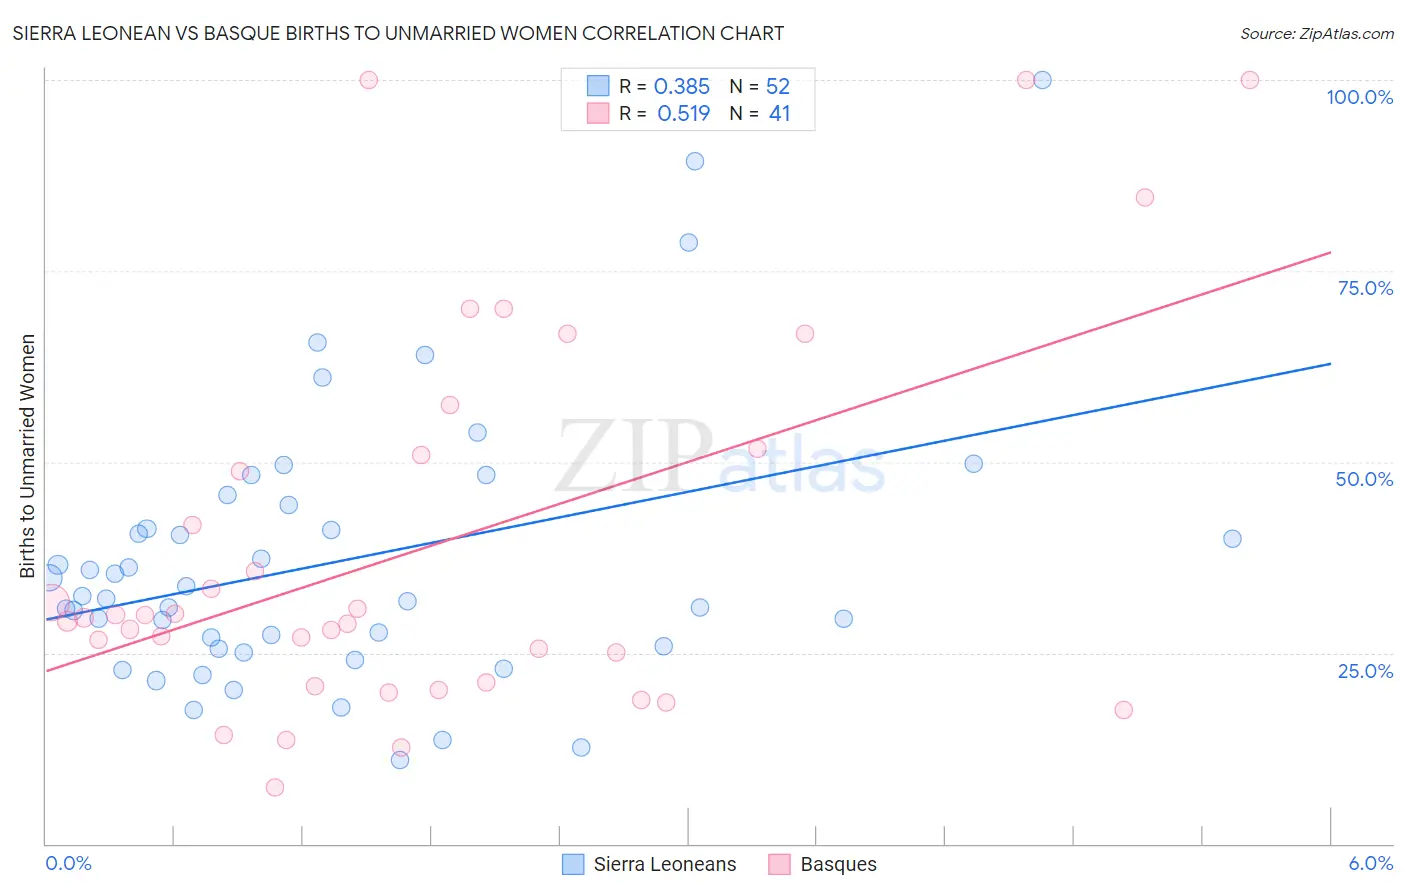
Sierra Leonean vs Basque Births to Unmarried Women Correlation Chart
The statistical analysis conducted on geographies consisting of 82,118,430 people shows a mild positive correlation between the proportion of Sierra Leoneans and percentage of births to unmarried women in the United States with a correlation coefficient (R) of 0.385 and weighted average of 34.9%. Similarly, the statistical analysis conducted on geographies consisting of 159,478,325 people shows a substantial positive correlation between the proportion of Basques and percentage of births to unmarried women in the United States with a correlation coefficient (R) of 0.519 and weighted average of 29.7%, a difference of 17.2%.
Births to Unmarried Women Correlation Summary
| Measurement | Sierra Leonean | Basque |
| Minimum | 11.0% | 7.4% |
| Maximum | 100.0% | 100.0% |
| Range | 89.0% | 92.6% |
| Mean | 37.0% | 38.8% |
| Median | 32.2% | 29.6% |
| Interquartile 25% (IQ1) | 25.7% | 20.9% |
| Interquartile 75% (IQ3) | 42.9% | 51.3% |
| Interquartile Range (IQR) | 17.1% | 30.5% |
| Standard Deviation (Sample) | 18.0% | 24.9% |
| Standard Deviation (Population) | 17.9% | 24.6% |
Similar Demographics by Births to Unmarried Women
Demographics Similar to Sierra Leoneans by Births to Unmarried Women
In terms of births to unmarried women, the demographic groups most similar to Sierra Leoneans are Immigrants from Cambodia (34.8%, a difference of 0.22%), Immigrants from Middle Africa (34.9%, a difference of 0.25%), Marshallese (34.8%, a difference of 0.28%), Immigrants from Guyana (35.0%, a difference of 0.28%), and Immigrants from Cameroon (34.7%, a difference of 0.36%).
| Demographics | Rating | Rank | Births to Unmarried Women |
| French Canadians | 2.5 /100 | #232 | Tragic 34.4% |
| Bangladeshis | 2.5 /100 | #233 | Tragic 34.4% |
| Immigrants | Zaire | 2.3 /100 | #234 | Tragic 34.5% |
| Immigrants | Ghana | 2.2 /100 | #235 | Tragic 34.5% |
| Immigrants | Cameroon | 1.6 /100 | #236 | Tragic 34.7% |
| Marshallese | 1.6 /100 | #237 | Tragic 34.8% |
| Immigrants | Cambodia | 1.6 /100 | #238 | Tragic 34.8% |
| Sierra Leoneans | 1.4 /100 | #239 | Tragic 34.9% |
| Immigrants | Middle Africa | 1.2 /100 | #240 | Tragic 34.9% |
| Immigrants | Guyana | 1.2 /100 | #241 | Tragic 35.0% |
| Indonesians | 1.2 /100 | #242 | Tragic 35.0% |
| Japanese | 0.9 /100 | #243 | Tragic 35.2% |
| Guyanese | 0.9 /100 | #244 | Tragic 35.2% |
| Shoshone | 0.8 /100 | #245 | Tragic 35.3% |
| Nigerians | 0.7 /100 | #246 | Tragic 35.3% |
Demographics Similar to Basques by Births to Unmarried Women
In terms of births to unmarried women, the demographic groups most similar to Basques are Immigrants from Hungary (29.7%, a difference of 0.010%), Scandinavian (29.8%, a difference of 0.10%), Immigrants from Ethiopia (29.7%, a difference of 0.15%), Immigrants from Croatia (29.8%, a difference of 0.16%), and Greek (29.7%, a difference of 0.18%).
| Demographics | Rating | Rank | Births to Unmarried Women |
| Immigrants | Nepal | 94.3 /100 | #105 | Exceptional 29.6% |
| Swedes | 93.8 /100 | #106 | Exceptional 29.6% |
| Immigrants | Brazil | 93.7 /100 | #107 | Exceptional 29.6% |
| Paraguayans | 93.5 /100 | #108 | Exceptional 29.7% |
| Greeks | 93.4 /100 | #109 | Exceptional 29.7% |
| Immigrants | Ethiopia | 93.4 /100 | #110 | Exceptional 29.7% |
| Immigrants | Hungary | 93.0 /100 | #111 | Exceptional 29.7% |
| Basques | 93.0 /100 | #112 | Exceptional 29.7% |
| Scandinavians | 92.7 /100 | #113 | Exceptional 29.8% |
| Immigrants | Croatia | 92.6 /100 | #114 | Exceptional 29.8% |
| Ethiopians | 91.9 /100 | #115 | Exceptional 29.8% |
| Immigrants | Italy | 91.7 /100 | #116 | Exceptional 29.9% |
| Immigrants | Netherlands | 91.1 /100 | #117 | Exceptional 29.9% |
| Immigrants | Norway | 91.0 /100 | #118 | Exceptional 29.9% |
| Argentineans | 90.5 /100 | #119 | Exceptional 30.0% |