Immigrants from Burma/Myanmar vs Aleut Householder Income Ages 45 - 64 years
COMPARE
Immigrants from Burma/Myanmar
Aleut
Householder Income Ages 45 - 64 years
Householder Income Ages 45 - 64 years Comparison
Immigrants from Burma/Myanmar
Aleuts
$91,385
HOUSEHOLDER INCOME AGES 45 - 64 YEARS
1.1/ 100
METRIC RATING
240th/ 347
METRIC RANK
$100,052
HOUSEHOLDER INCOME AGES 45 - 64 YEARS
46.6/ 100
METRIC RATING
180th/ 347
METRIC RANK
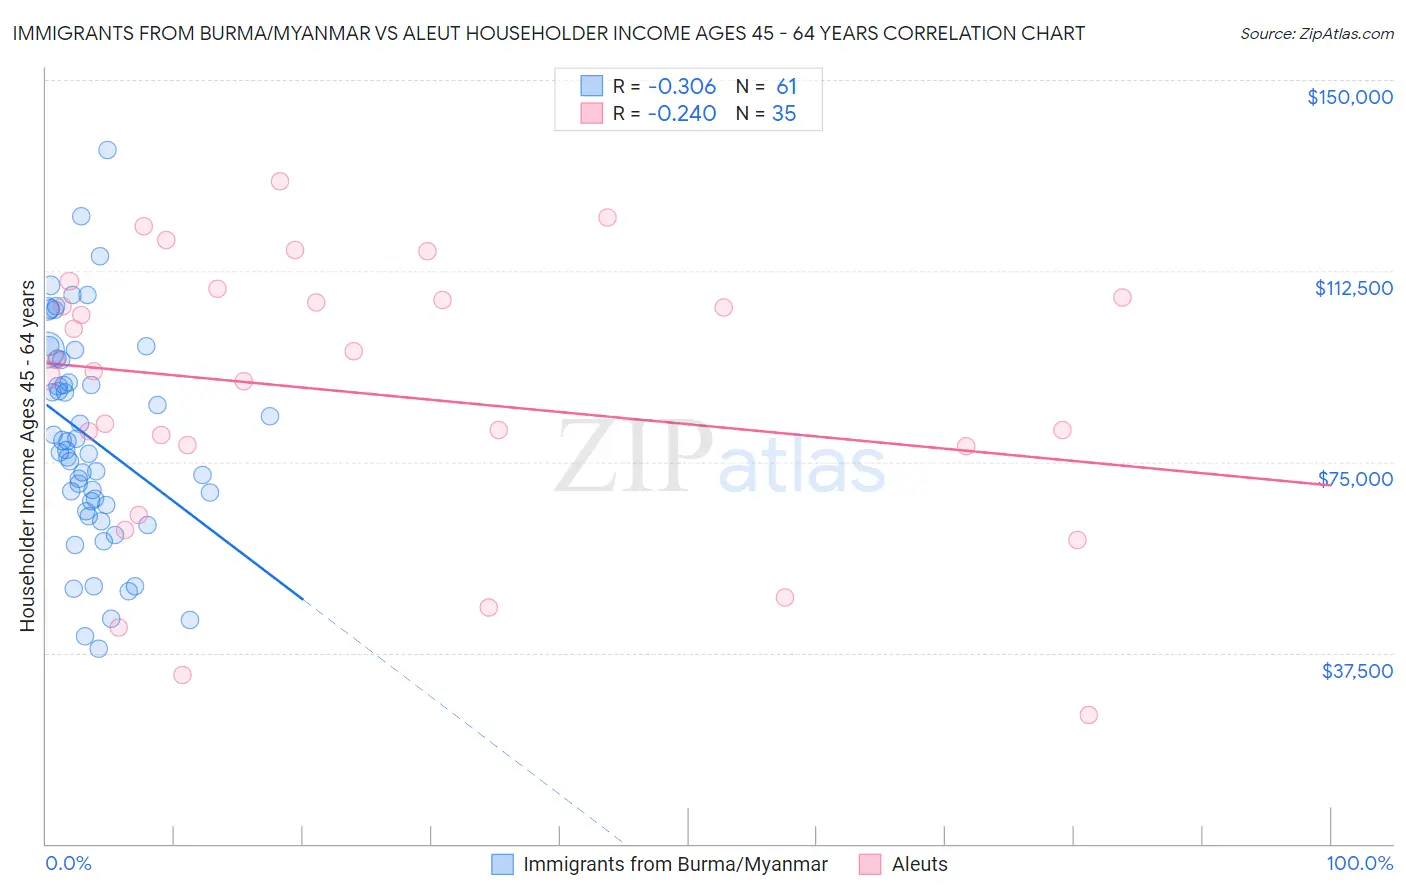
Immigrants from Burma/Myanmar vs Aleut Householder Income Ages 45 - 64 years Correlation Chart
The statistical analysis conducted on geographies consisting of 172,192,381 people shows a mild negative correlation between the proportion of Immigrants from Burma/Myanmar and household income with householder between the ages 45 and 64 in the United States with a correlation coefficient (R) of -0.306 and weighted average of $91,385. Similarly, the statistical analysis conducted on geographies consisting of 61,745,960 people shows a weak negative correlation between the proportion of Aleuts and household income with householder between the ages 45 and 64 in the United States with a correlation coefficient (R) of -0.240 and weighted average of $100,052, a difference of 9.5%.
Householder Income Ages 45 - 64 years Correlation Summary
| Measurement | Immigrants from Burma/Myanmar | Aleut |
| Minimum | $38,314 | $25,250 |
| Maximum | $136,250 | $130,063 |
| Range | $97,936 | $104,813 |
| Mean | $79,553 | $88,376 |
| Median | $77,270 | $92,906 |
| Interquartile 25% (IQ1) | $66,032 | $78,125 |
| Interquartile 75% (IQ3) | $95,170 | $107,188 |
| Interquartile Range (IQR) | $29,138 | $29,063 |
| Standard Deviation (Sample) | $21,018 | $26,902 |
| Standard Deviation (Population) | $20,845 | $26,515 |
Similar Demographics by Householder Income Ages 45 - 64 years
Demographics Similar to Immigrants from Burma/Myanmar by Householder Income Ages 45 - 64 years
In terms of householder income ages 45 - 64 years, the demographic groups most similar to Immigrants from Burma/Myanmar are Trinidadian and Tobagonian ($91,357, a difference of 0.030%), Inupiat ($91,355, a difference of 0.030%), Immigrants from Trinidad and Tobago ($91,347, a difference of 0.040%), Immigrants from Ecuador ($91,462, a difference of 0.080%), and Immigrants from Middle Africa ($91,293, a difference of 0.10%).
| Demographics | Rating | Rank | Householder Income Ages 45 - 64 years |
| Nepalese | 3.0 /100 | #233 | Tragic $93,355 |
| Immigrants | El Salvador | 2.7 /100 | #234 | Tragic $93,176 |
| Nicaraguans | 2.0 /100 | #235 | Tragic $92,554 |
| Immigrants | Western Africa | 1.8 /100 | #236 | Tragic $92,384 |
| Immigrants | Bangladesh | 1.7 /100 | #237 | Tragic $92,208 |
| Pennsylvania Germans | 1.5 /100 | #238 | Tragic $91,956 |
| Immigrants | Ecuador | 1.2 /100 | #239 | Tragic $91,462 |
| Immigrants | Burma/Myanmar | 1.1 /100 | #240 | Tragic $91,385 |
| Trinidadians and Tobagonians | 1.1 /100 | #241 | Tragic $91,357 |
| Inupiat | 1.1 /100 | #242 | Tragic $91,355 |
| Immigrants | Trinidad and Tobago | 1.1 /100 | #243 | Tragic $91,347 |
| Immigrants | Middle Africa | 1.1 /100 | #244 | Tragic $91,293 |
| Guyanese | 0.9 /100 | #245 | Tragic $90,966 |
| Central Americans | 0.9 /100 | #246 | Tragic $90,951 |
| Alaskan Athabascans | 0.9 /100 | #247 | Tragic $90,951 |
Demographics Similar to Aleuts by Householder Income Ages 45 - 64 years
In terms of householder income ages 45 - 64 years, the demographic groups most similar to Aleuts are Belgian ($100,060, a difference of 0.010%), Immigrants from Cameroon ($100,084, a difference of 0.030%), Immigrants from Costa Rica ($100,141, a difference of 0.090%), Moroccan ($100,138, a difference of 0.090%), and Immigrants ($99,943, a difference of 0.11%).
| Demographics | Rating | Rank | Householder Income Ages 45 - 64 years |
| Alsatians | 51.4 /100 | #173 | Average $100,435 |
| Welsh | 50.0 /100 | #174 | Average $100,322 |
| Germans | 48.8 /100 | #175 | Average $100,224 |
| Immigrants | Costa Rica | 47.7 /100 | #176 | Average $100,141 |
| Moroccans | 47.7 /100 | #177 | Average $100,138 |
| Immigrants | Cameroon | 47.0 /100 | #178 | Average $100,084 |
| Belgians | 46.7 /100 | #179 | Average $100,060 |
| Aleuts | 46.6 /100 | #180 | Average $100,052 |
| Immigrants | Immigrants | 45.3 /100 | #181 | Average $99,943 |
| Finns | 44.8 /100 | #182 | Average $99,904 |
| Spaniards | 44.6 /100 | #183 | Average $99,889 |
| French | 43.8 /100 | #184 | Average $99,824 |
| Colombians | 43.2 /100 | #185 | Average $99,772 |
| Dutch | 41.7 /100 | #186 | Average $99,650 |
| Iraqis | 38.5 /100 | #187 | Fair $99,387 |