Immigrants from Eritrea vs Aleut Single Mother Households
COMPARE
Immigrants from Eritrea
Aleut
Single Mother Households
Single Mother Households Comparison
Immigrants from Eritrea
Aleuts
6.7%
SINGLE MOTHER HOUSEHOLDS
8.4/ 100
METRIC RATING
212th/ 347
METRIC RANK
6.8%
SINGLE MOTHER HOUSEHOLDS
4.8/ 100
METRIC RATING
217th/ 347
METRIC RANK
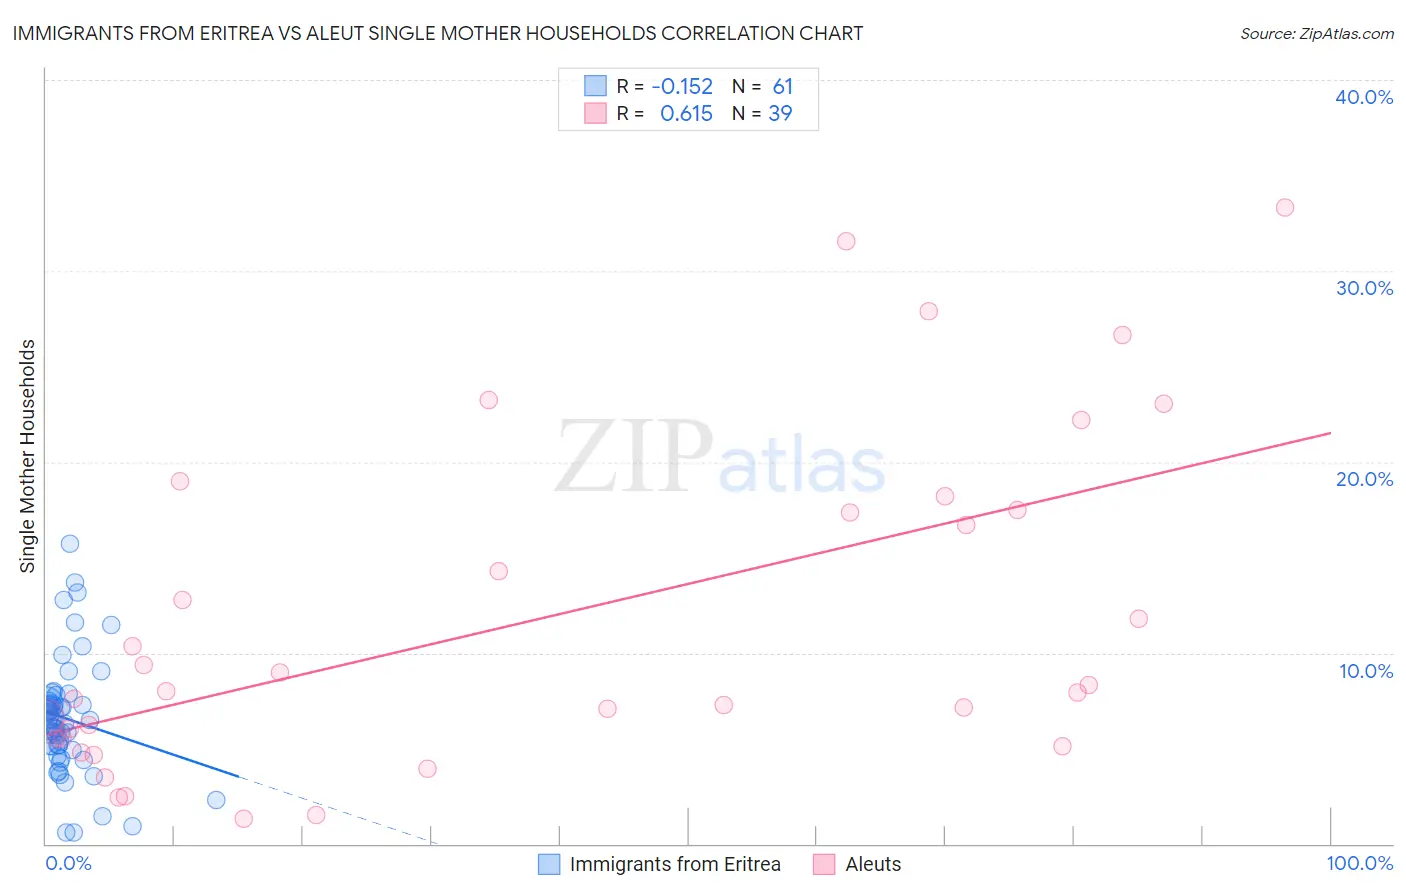
Immigrants from Eritrea vs Aleut Single Mother Households Correlation Chart
The statistical analysis conducted on geographies consisting of 104,781,978 people shows a poor negative correlation between the proportion of Immigrants from Eritrea and percentage of single mother households in the United States with a correlation coefficient (R) of -0.152 and weighted average of 6.7%. Similarly, the statistical analysis conducted on geographies consisting of 61,699,549 people shows a significant positive correlation between the proportion of Aleuts and percentage of single mother households in the United States with a correlation coefficient (R) of 0.615 and weighted average of 6.8%, a difference of 1.5%.
Single Mother Households Correlation Summary
| Measurement | Immigrants from Eritrea | Aleut |
| Minimum | 0.57% | 1.3% |
| Maximum | 15.7% | 33.3% |
| Range | 15.2% | 32.0% |
| Mean | 6.5% | 11.7% |
| Median | 6.5% | 8.0% |
| Interquartile 25% (IQ1) | 5.0% | 5.5% |
| Interquartile 75% (IQ3) | 7.4% | 17.5% |
| Interquartile Range (IQR) | 2.4% | 12.0% |
| Standard Deviation (Sample) | 3.0% | 8.7% |
| Standard Deviation (Population) | 3.0% | 8.6% |
Demographics Similar to Immigrants from Eritrea and Aleuts by Single Mother Households
In terms of single mother households, the demographic groups most similar to Immigrants from Eritrea are Immigrants from Venezuela (6.7%, a difference of 0.050%), Immigrants from Costa Rica (6.7%, a difference of 0.050%), Immigrants from Uruguay (6.7%, a difference of 0.16%), Nonimmigrants (6.7%, a difference of 0.63%), and Immigrants from Colombia (6.7%, a difference of 0.65%). Similarly, the demographic groups most similar to Aleuts are Cherokee (6.8%, a difference of 0.14%), Immigrants from Eastern Africa (6.8%, a difference of 0.21%), Immigrants (6.8%, a difference of 0.30%), Shoshone (6.8%, a difference of 0.44%), and Immigrants from Thailand (6.9%, a difference of 0.49%).
| Demographics | Rating | Rank | Single Mother Households |
| Immigrants | Fiji | 11.9 /100 | #204 | Poor 6.7% |
| Cree | 11.9 /100 | #205 | Poor 6.7% |
| German Russians | 11.5 /100 | #206 | Poor 6.7% |
| Immigrants | South America | 11.5 /100 | #207 | Poor 6.7% |
| Vietnamese | 11.3 /100 | #208 | Poor 6.7% |
| Immigrants | Colombia | 10.5 /100 | #209 | Poor 6.7% |
| Immigrants | Nonimmigrants | 10.4 /100 | #210 | Poor 6.7% |
| Immigrants | Venezuela | 8.5 /100 | #211 | Tragic 6.7% |
| Immigrants | Eritrea | 8.4 /100 | #212 | Tragic 6.7% |
| Immigrants | Costa Rica | 8.2 /100 | #213 | Tragic 6.7% |
| Immigrants | Uruguay | 7.9 /100 | #214 | Tragic 6.7% |
| Shoshone | 5.7 /100 | #215 | Tragic 6.8% |
| Cherokee | 5.1 /100 | #216 | Tragic 6.8% |
| Aleuts | 4.8 /100 | #217 | Tragic 6.8% |
| Immigrants | Eastern Africa | 4.4 /100 | #218 | Tragic 6.8% |
| Immigrants | Immigrants | 4.3 /100 | #219 | Tragic 6.8% |
| Immigrants | Thailand | 4.0 /100 | #220 | Tragic 6.9% |
| French American Indians | 3.7 /100 | #221 | Tragic 6.9% |
| Immigrants | Bangladesh | 3.7 /100 | #222 | Tragic 6.9% |
| Immigrants | Micronesia | 3.6 /100 | #223 | Tragic 6.9% |
| Immigrants | Sudan | 3.5 /100 | #224 | Tragic 6.9% |