Basque vs Aleut Single Mother Households
COMPARE
Basque
Aleut
Single Mother Households
Single Mother Households Comparison
Basques
Aleuts
5.7%
SINGLE MOTHER HOUSEHOLDS
96.7/ 100
METRIC RATING
94th/ 347
METRIC RANK
6.8%
SINGLE MOTHER HOUSEHOLDS
4.8/ 100
METRIC RATING
217th/ 347
METRIC RANK
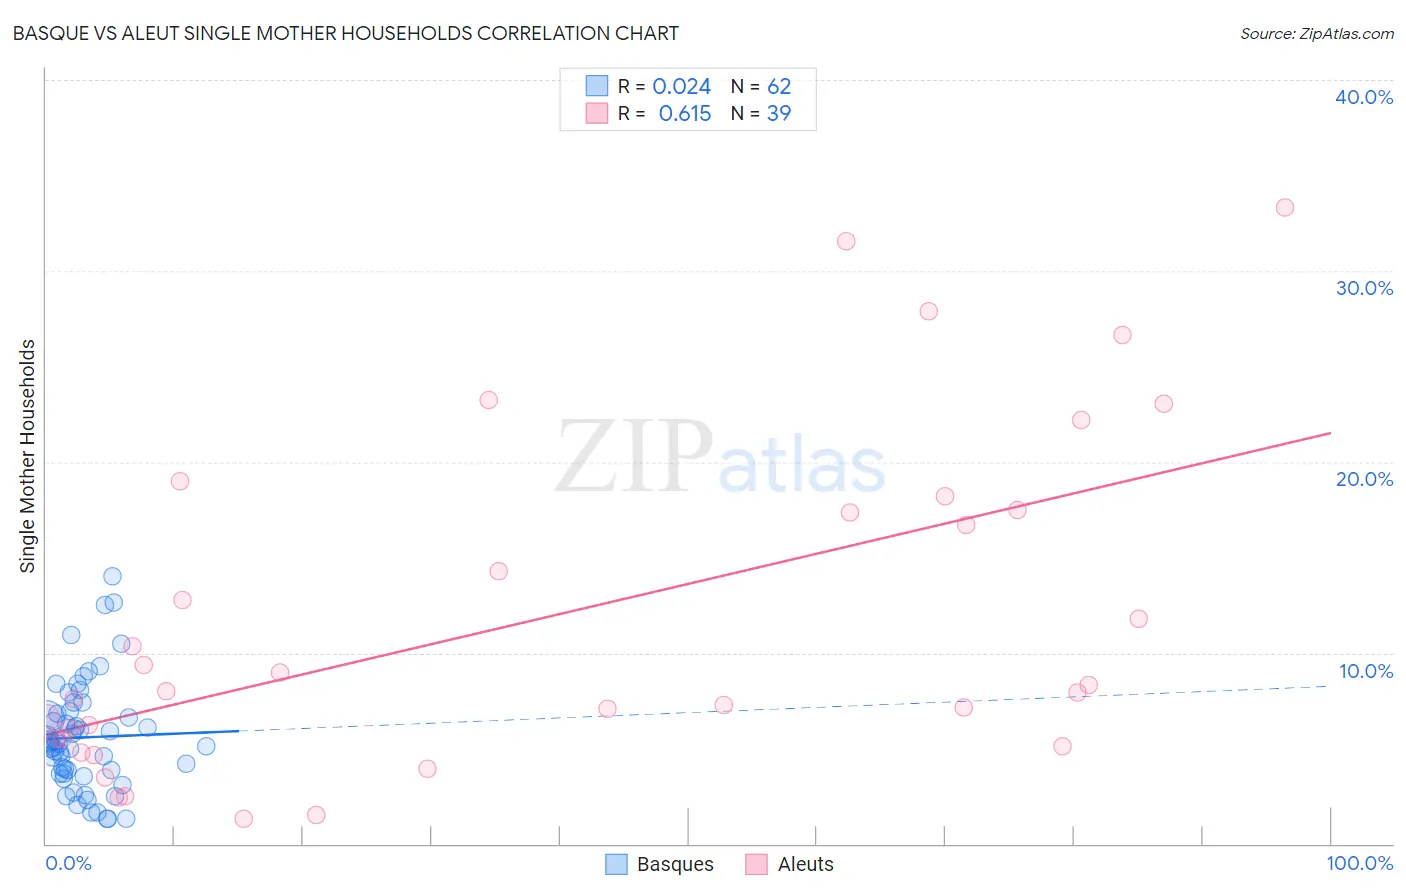
Basque vs Aleut Single Mother Households Correlation Chart
The statistical analysis conducted on geographies consisting of 165,555,400 people shows no correlation between the proportion of Basques and percentage of single mother households in the United States with a correlation coefficient (R) of 0.024 and weighted average of 5.7%. Similarly, the statistical analysis conducted on geographies consisting of 61,699,549 people shows a significant positive correlation between the proportion of Aleuts and percentage of single mother households in the United States with a correlation coefficient (R) of 0.615 and weighted average of 6.8%, a difference of 19.1%.
Single Mother Households Correlation Summary
| Measurement | Basque | Aleut |
| Minimum | 1.3% | 1.3% |
| Maximum | 14.0% | 33.3% |
| Range | 12.7% | 32.0% |
| Mean | 5.6% | 11.7% |
| Median | 5.2% | 8.0% |
| Interquartile 25% (IQ1) | 3.7% | 5.5% |
| Interquartile 75% (IQ3) | 6.8% | 17.5% |
| Interquartile Range (IQR) | 3.1% | 12.0% |
| Standard Deviation (Sample) | 2.8% | 8.7% |
| Standard Deviation (Population) | 2.8% | 8.6% |
Similar Demographics by Single Mother Households
Demographics Similar to Basques by Single Mother Households
In terms of single mother households, the demographic groups most similar to Basques are Serbian (5.7%, a difference of 0.050%), Immigrants from Western Asia (5.7%, a difference of 0.060%), Slovak (5.7%, a difference of 0.060%), Austrian (5.7%, a difference of 0.21%), and Tlingit-Haida (5.7%, a difference of 0.26%).
| Demographics | Rating | Rank | Single Mother Households |
| Immigrants | Turkey | 97.5 /100 | #87 | Exceptional 5.7% |
| Israelis | 97.4 /100 | #88 | Exceptional 5.7% |
| Ukrainians | 97.2 /100 | #89 | Exceptional 5.7% |
| Immigrants | Indonesia | 97.2 /100 | #90 | Exceptional 5.7% |
| Europeans | 97.0 /100 | #91 | Exceptional 5.7% |
| Immigrants | Western Asia | 96.7 /100 | #92 | Exceptional 5.7% |
| Serbians | 96.7 /100 | #93 | Exceptional 5.7% |
| Basques | 96.7 /100 | #94 | Exceptional 5.7% |
| Slovaks | 96.6 /100 | #95 | Exceptional 5.7% |
| Austrians | 96.4 /100 | #96 | Exceptional 5.7% |
| Tlingit-Haida | 96.4 /100 | #97 | Exceptional 5.7% |
| Immigrants | South Africa | 96.3 /100 | #98 | Exceptional 5.7% |
| Immigrants | Poland | 96.3 /100 | #99 | Exceptional 5.8% |
| Scandinavians | 96.2 /100 | #100 | Exceptional 5.8% |
| Germans | 96.2 /100 | #101 | Exceptional 5.8% |
Demographics Similar to Aleuts by Single Mother Households
In terms of single mother households, the demographic groups most similar to Aleuts are Cherokee (6.8%, a difference of 0.14%), Immigrants from Eastern Africa (6.8%, a difference of 0.21%), Immigrants (6.8%, a difference of 0.30%), Shoshone (6.8%, a difference of 0.44%), and Immigrants from Thailand (6.9%, a difference of 0.49%).
| Demographics | Rating | Rank | Single Mother Households |
| Immigrants | Nonimmigrants | 10.4 /100 | #210 | Poor 6.7% |
| Immigrants | Venezuela | 8.5 /100 | #211 | Tragic 6.7% |
| Immigrants | Eritrea | 8.4 /100 | #212 | Tragic 6.7% |
| Immigrants | Costa Rica | 8.2 /100 | #213 | Tragic 6.7% |
| Immigrants | Uruguay | 7.9 /100 | #214 | Tragic 6.7% |
| Shoshone | 5.7 /100 | #215 | Tragic 6.8% |
| Cherokee | 5.1 /100 | #216 | Tragic 6.8% |
| Aleuts | 4.8 /100 | #217 | Tragic 6.8% |
| Immigrants | Eastern Africa | 4.4 /100 | #218 | Tragic 6.8% |
| Immigrants | Immigrants | 4.3 /100 | #219 | Tragic 6.8% |
| Immigrants | Thailand | 4.0 /100 | #220 | Tragic 6.9% |
| French American Indians | 3.7 /100 | #221 | Tragic 6.9% |
| Immigrants | Bangladesh | 3.7 /100 | #222 | Tragic 6.9% |
| Immigrants | Micronesia | 3.6 /100 | #223 | Tragic 6.9% |
| Immigrants | Sudan | 3.5 /100 | #224 | Tragic 6.9% |