Immigrants from Burma/Myanmar vs Aleut 4th Grade
COMPARE
Immigrants from Burma/Myanmar
Aleut
4th Grade
4th Grade Comparison
Immigrants from Burma/Myanmar
Aleuts
96.3%
4TH GRADE
0.0/ 100
METRIC RATING
310th/ 347
METRIC RANK
98.2%
4TH GRADE
99.9/ 100
METRIC RATING
38th/ 347
METRIC RANK
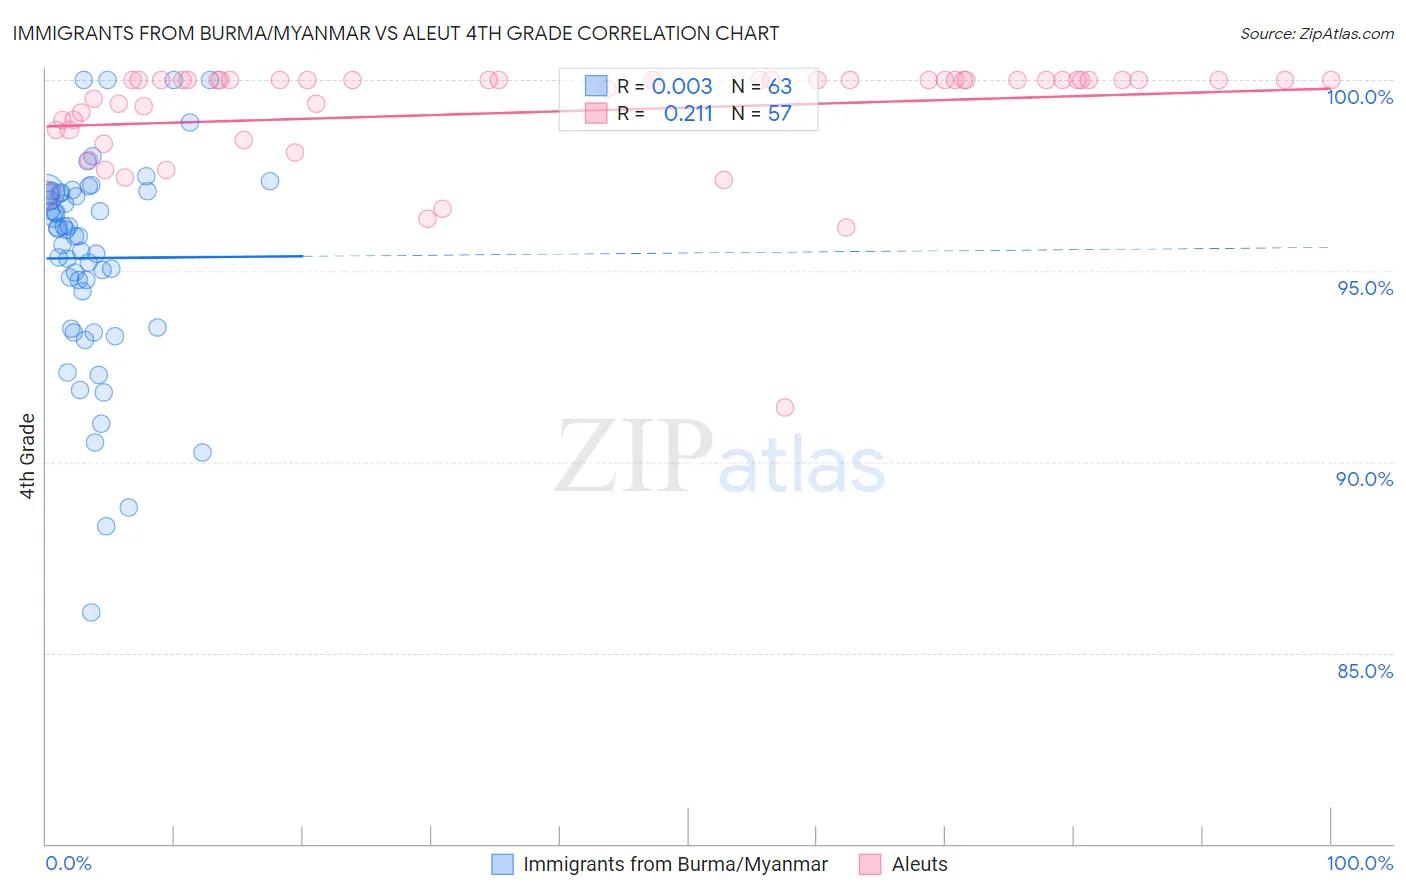
Immigrants from Burma/Myanmar vs Aleut 4th Grade Correlation Chart
The statistical analysis conducted on geographies consisting of 172,338,093 people shows no correlation between the proportion of Immigrants from Burma/Myanmar and percentage of population with at least 4th grade education in the United States with a correlation coefficient (R) of 0.003 and weighted average of 96.3%. Similarly, the statistical analysis conducted on geographies consisting of 61,781,058 people shows a weak positive correlation between the proportion of Aleuts and percentage of population with at least 4th grade education in the United States with a correlation coefficient (R) of 0.211 and weighted average of 98.2%, a difference of 2.0%.
4th Grade Correlation Summary
| Measurement | Immigrants from Burma/Myanmar | Aleut |
| Minimum | 86.0% | 91.4% |
| Maximum | 100.0% | 100.0% |
| Range | 14.0% | 8.6% |
| Mean | 95.3% | 99.2% |
| Median | 96.1% | 100.0% |
| Interquartile 25% (IQ1) | 93.5% | 98.7% |
| Interquartile 75% (IQ3) | 97.1% | 100.0% |
| Interquartile Range (IQR) | 3.6% | 1.3% |
| Standard Deviation (Sample) | 2.8% | 1.5% |
| Standard Deviation (Population) | 2.8% | 1.5% |
Similar Demographics by 4th Grade
Demographics Similar to Immigrants from Burma/Myanmar by 4th Grade
In terms of 4th grade, the demographic groups most similar to Immigrants from Burma/Myanmar are Immigrants from Guyana (96.3%, a difference of 0.020%), Immigrants from Laos (96.3%, a difference of 0.030%), Immigrants from Haiti (96.3%, a difference of 0.040%), Immigrants from Bangladesh (96.2%, a difference of 0.050%), and Cape Verdean (96.2%, a difference of 0.050%).
| Demographics | Rating | Rank | 4th Grade |
| Guyanese | 0.0 /100 | #303 | Tragic 96.4% |
| Ecuadorians | 0.0 /100 | #304 | Tragic 96.4% |
| Immigrants | Caribbean | 0.0 /100 | #305 | Tragic 96.4% |
| Sri Lankans | 0.0 /100 | #306 | Tragic 96.4% |
| Immigrants | Haiti | 0.0 /100 | #307 | Tragic 96.3% |
| Immigrants | Laos | 0.0 /100 | #308 | Tragic 96.3% |
| Immigrants | Guyana | 0.0 /100 | #309 | Tragic 96.3% |
| Immigrants | Burma/Myanmar | 0.0 /100 | #310 | Tragic 96.3% |
| Immigrants | Bangladesh | 0.0 /100 | #311 | Tragic 96.2% |
| Cape Verdeans | 0.0 /100 | #312 | Tragic 96.2% |
| Indonesians | 0.0 /100 | #313 | Tragic 96.2% |
| Vietnamese | 0.0 /100 | #314 | Tragic 96.2% |
| Nicaraguans | 0.0 /100 | #315 | Tragic 96.2% |
| Immigrants | Ecuador | 0.0 /100 | #316 | Tragic 96.2% |
| Central American Indians | 0.0 /100 | #317 | Tragic 96.2% |
Demographics Similar to Aleuts by 4th Grade
In terms of 4th grade, the demographic groups most similar to Aleuts are Latvian (98.2%, a difference of 0.0%), Belgian (98.2%, a difference of 0.010%), Luxembourger (98.2%, a difference of 0.010%), British (98.2%, a difference of 0.020%), and Eastern European (98.2%, a difference of 0.020%).
| Demographics | Rating | Rank | 4th Grade |
| Europeans | 100.0 /100 | #31 | Exceptional 98.3% |
| Chinese | 100.0 /100 | #32 | Exceptional 98.3% |
| Swiss | 100.0 /100 | #33 | Exceptional 98.2% |
| Chippewa | 100.0 /100 | #34 | Exceptional 98.2% |
| Italians | 100.0 /100 | #35 | Exceptional 98.2% |
| British | 100.0 /100 | #36 | Exceptional 98.2% |
| Latvians | 99.9 /100 | #37 | Exceptional 98.2% |
| Aleuts | 99.9 /100 | #38 | Exceptional 98.2% |
| Belgians | 99.9 /100 | #39 | Exceptional 98.2% |
| Luxembourgers | 99.9 /100 | #40 | Exceptional 98.2% |
| Eastern Europeans | 99.9 /100 | #41 | Exceptional 98.2% |
| Hungarians | 99.9 /100 | #42 | Exceptional 98.2% |
| Northern Europeans | 99.9 /100 | #43 | Exceptional 98.2% |
| Native Hawaiians | 99.9 /100 | #44 | Exceptional 98.1% |
| Czechoslovakians | 99.9 /100 | #45 | Exceptional 98.1% |