Immigrants from Brazil vs Latvian Self-Care Disability
COMPARE
Immigrants from Brazil
Latvian
Self-Care Disability
Self-Care Disability Comparison
Immigrants from Brazil
Latvians
2.3%
SELF-CARE DISABILITY
99.7/ 100
METRIC RATING
50th/ 347
METRIC RANK
2.3%
SELF-CARE DISABILITY
99.7/ 100
METRIC RATING
49th/ 347
METRIC RANK
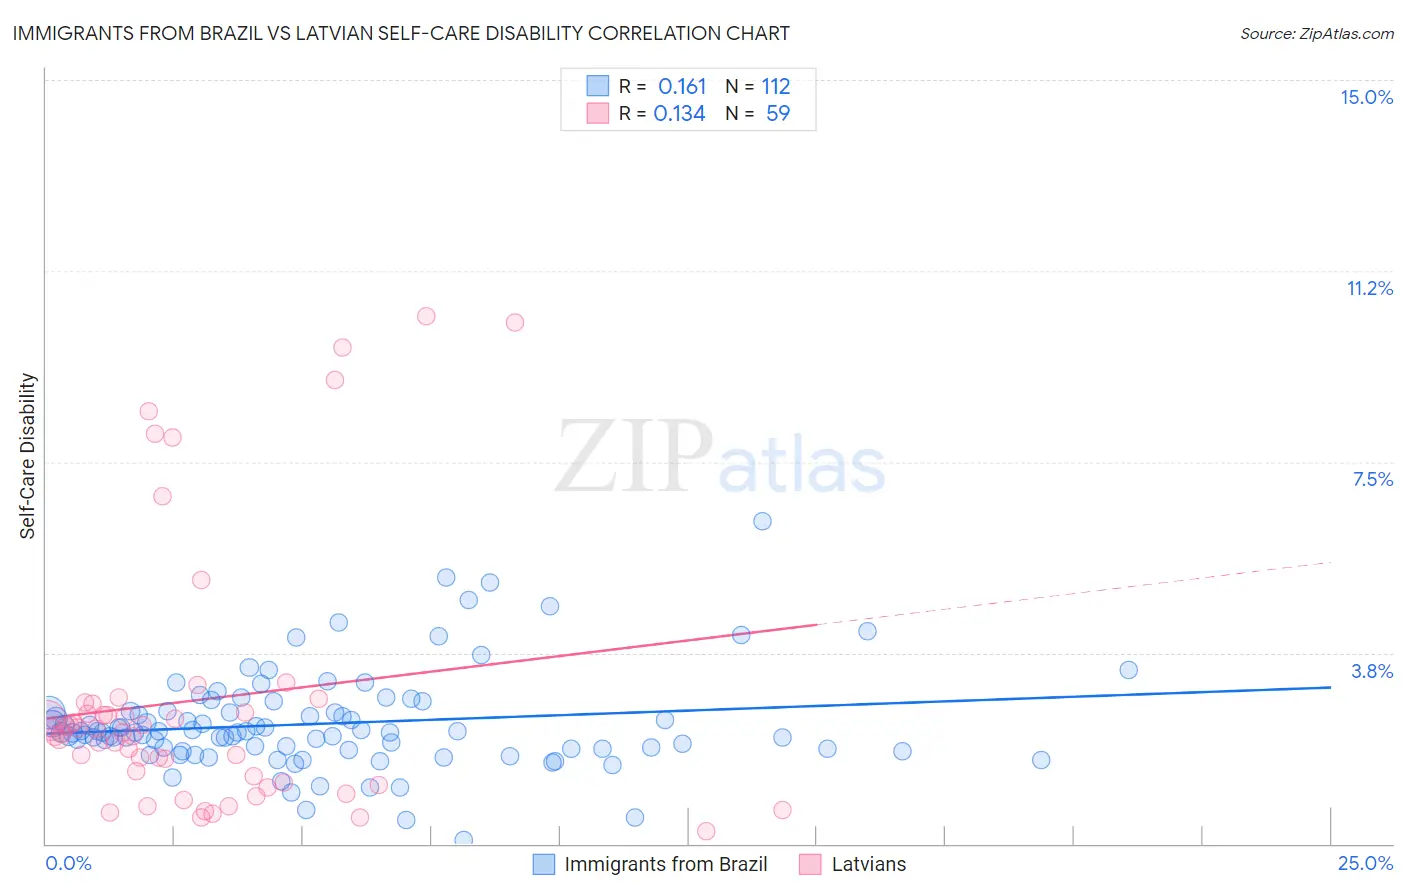
Immigrants from Brazil vs Latvian Self-Care Disability Correlation Chart
The statistical analysis conducted on geographies consisting of 342,700,860 people shows a poor positive correlation between the proportion of Immigrants from Brazil and percentage of population with self-care disability in the United States with a correlation coefficient (R) of 0.161 and weighted average of 2.3%. Similarly, the statistical analysis conducted on geographies consisting of 220,536,730 people shows a poor positive correlation between the proportion of Latvians and percentage of population with self-care disability in the United States with a correlation coefficient (R) of 0.134 and weighted average of 2.3%, a difference of 0.020%.
Self-Care Disability Correlation Summary
| Measurement | Immigrants from Brazil | Latvian |
| Minimum | 0.076% | 0.23% |
| Maximum | 6.3% | 10.4% |
| Range | 6.3% | 10.1% |
| Mean | 2.4% | 2.8% |
| Median | 2.2% | 2.2% |
| Interquartile 25% (IQ1) | 1.9% | 1.2% |
| Interquartile 75% (IQ3) | 2.6% | 2.8% |
| Interquartile Range (IQR) | 0.73% | 1.6% |
| Standard Deviation (Sample) | 0.97% | 2.6% |
| Standard Deviation (Population) | 0.97% | 2.6% |
Demographics Similar to Immigrants from Brazil and Latvians by Self-Care Disability
In terms of self-care disability, the demographic groups most similar to Immigrants from Brazil are Kenyan (2.3%, a difference of 0.15%), Immigrants from Serbia (2.3%, a difference of 0.17%), Immigrants from Malaysia (2.3%, a difference of 0.20%), Australian (2.3%, a difference of 0.20%), and Jordanian (2.3%, a difference of 0.24%). Similarly, the demographic groups most similar to Latvians are Immigrants from Malaysia (2.3%, a difference of 0.17%), Kenyan (2.3%, a difference of 0.17%), Immigrants from Serbia (2.3%, a difference of 0.19%), Jordanian (2.3%, a difference of 0.22%), and Australian (2.3%, a difference of 0.23%).
| Demographics | Rating | Rank | Self-Care Disability |
| Immigrants | Bulgaria | 99.8 /100 | #39 | Exceptional 2.3% |
| Iranians | 99.8 /100 | #40 | Exceptional 2.3% |
| Immigrants | Sudan | 99.8 /100 | #41 | Exceptional 2.3% |
| Immigrants | Uganda | 99.8 /100 | #42 | Exceptional 2.3% |
| Immigrants | Pakistan | 99.8 /100 | #43 | Exceptional 2.3% |
| Immigrants | South Africa | 99.8 /100 | #44 | Exceptional 2.3% |
| Norwegians | 99.8 /100 | #45 | Exceptional 2.3% |
| Czechs | 99.8 /100 | #46 | Exceptional 2.3% |
| Jordanians | 99.7 /100 | #47 | Exceptional 2.3% |
| Immigrants | Malaysia | 99.7 /100 | #48 | Exceptional 2.3% |
| Latvians | 99.7 /100 | #49 | Exceptional 2.3% |
| Immigrants | Brazil | 99.7 /100 | #50 | Exceptional 2.3% |
| Kenyans | 99.7 /100 | #51 | Exceptional 2.3% |
| Immigrants | Serbia | 99.6 /100 | #52 | Exceptional 2.3% |
| Australians | 99.6 /100 | #53 | Exceptional 2.3% |
| Argentineans | 99.6 /100 | #54 | Exceptional 2.3% |
| Immigrants | France | 99.6 /100 | #55 | Exceptional 2.3% |
| Immigrants | Eastern Asia | 99.6 /100 | #56 | Exceptional 2.3% |
| Immigrants | Belgium | 99.6 /100 | #57 | Exceptional 2.3% |
| Immigrants | Cameroon | 99.6 /100 | #58 | Exceptional 2.3% |
| New Zealanders | 99.5 /100 | #59 | Exceptional 2.3% |