Immigrants from Brazil vs Yaqui Currently Married
COMPARE
Immigrants from Brazil
Yaqui
Currently Married
Currently Married Comparison
Immigrants from Brazil
Yaqui
46.6%
CURRENTLY MARRIED
49.9/ 100
METRIC RATING
175th/ 347
METRIC RANK
43.4%
CURRENTLY MARRIED
0.1/ 100
METRIC RATING
273rd/ 347
METRIC RANK
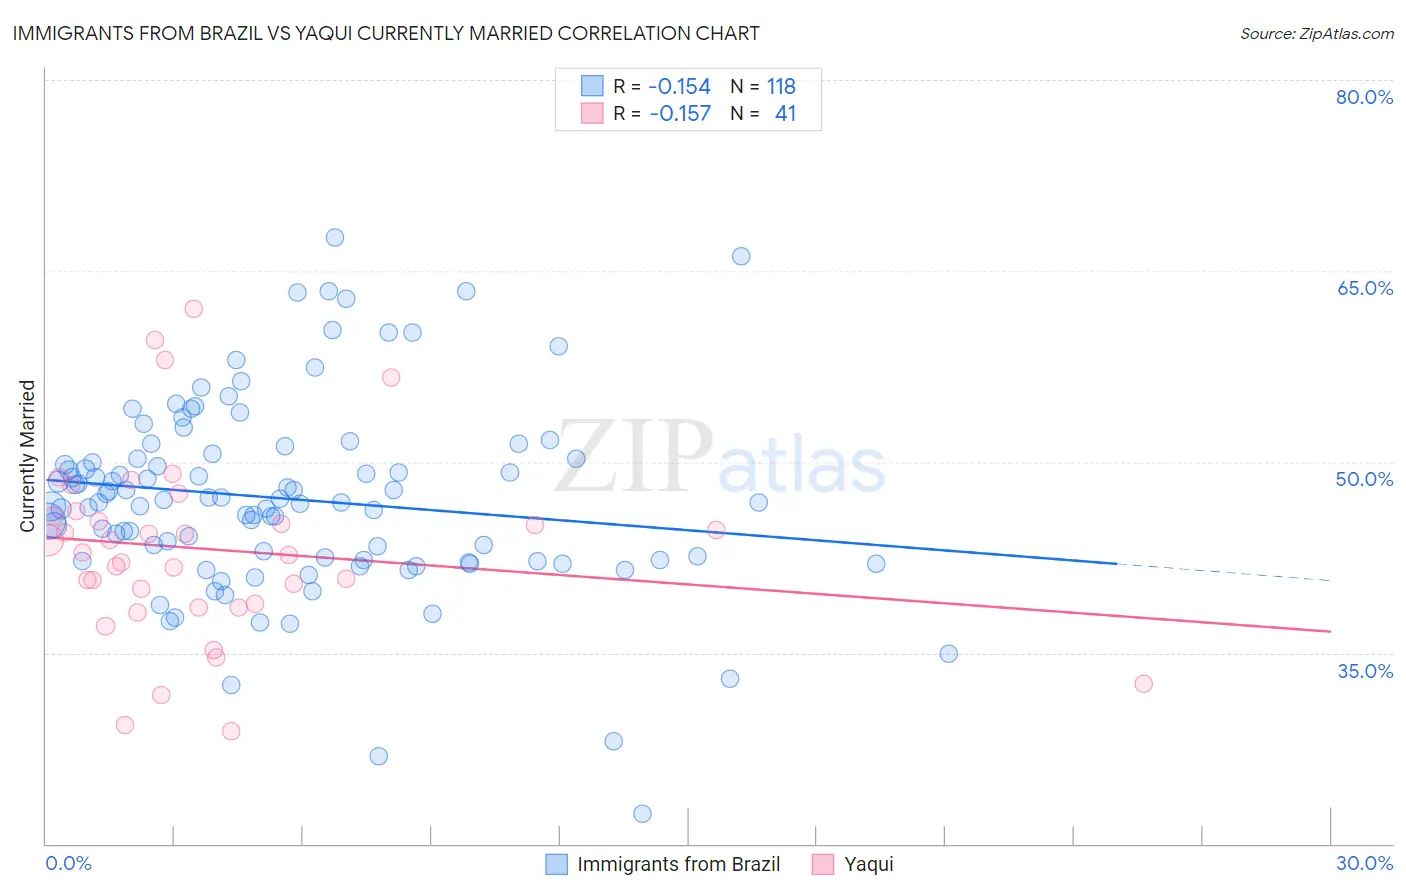
Immigrants from Brazil vs Yaqui Currently Married Correlation Chart
The statistical analysis conducted on geographies consisting of 342,973,445 people shows a poor negative correlation between the proportion of Immigrants from Brazil and percentage of population currently married in the United States with a correlation coefficient (R) of -0.154 and weighted average of 46.6%. Similarly, the statistical analysis conducted on geographies consisting of 107,738,640 people shows a poor negative correlation between the proportion of Yaqui and percentage of population currently married in the United States with a correlation coefficient (R) of -0.157 and weighted average of 43.4%, a difference of 7.3%.
Currently Married Correlation Summary
| Measurement | Immigrants from Brazil | Yaqui |
| Minimum | 22.4% | 28.9% |
| Maximum | 67.6% | 62.0% |
| Range | 45.2% | 33.1% |
| Mean | 47.1% | 43.1% |
| Median | 46.8% | 42.9% |
| Interquartile 25% (IQ1) | 42.3% | 38.7% |
| Interquartile 75% (IQ3) | 50.3% | 45.9% |
| Interquartile Range (IQR) | 8.0% | 7.2% |
| Standard Deviation (Sample) | 7.6% | 7.3% |
| Standard Deviation (Population) | 7.6% | 7.2% |
Similar Demographics by Currently Married
Demographics Similar to Immigrants from Brazil by Currently Married
In terms of currently married, the demographic groups most similar to Immigrants from Brazil are Peruvian (46.6%, a difference of 0.010%), Tlingit-Haida (46.7%, a difference of 0.050%), Hawaiian (46.6%, a difference of 0.050%), Israeli (46.6%, a difference of 0.050%), and Chickasaw (46.6%, a difference of 0.070%).
| Demographics | Rating | Rank | Currently Married |
| Immigrants | Afghanistan | 58.2 /100 | #168 | Average 46.8% |
| Armenians | 58.2 /100 | #169 | Average 46.8% |
| Immigrants | Latvia | 56.7 /100 | #170 | Average 46.7% |
| Immigrants | Zimbabwe | 52.4 /100 | #171 | Average 46.7% |
| Aleuts | 52.0 /100 | #172 | Average 46.7% |
| Tlingit-Haida | 51.2 /100 | #173 | Average 46.7% |
| Peruvians | 50.0 /100 | #174 | Average 46.6% |
| Immigrants | Brazil | 49.9 /100 | #175 | Average 46.6% |
| Hawaiians | 48.6 /100 | #176 | Average 46.6% |
| Israelis | 48.6 /100 | #177 | Average 46.6% |
| Chickasaw | 47.8 /100 | #178 | Average 46.6% |
| Immigrants | Oceania | 44.6 /100 | #179 | Average 46.5% |
| Costa Ricans | 43.7 /100 | #180 | Average 46.5% |
| Ottawa | 43.0 /100 | #181 | Average 46.5% |
| Potawatomi | 41.9 /100 | #182 | Average 46.5% |
Demographics Similar to Yaqui by Currently Married
In terms of currently married, the demographic groups most similar to Yaqui are Nigerian (43.4%, a difference of 0.020%), Indonesian (43.5%, a difference of 0.040%), Colville (43.4%, a difference of 0.040%), Sierra Leonean (43.4%, a difference of 0.070%), and Immigrants from Nigeria (43.4%, a difference of 0.070%).
| Demographics | Rating | Rank | Currently Married |
| Ecuadorians | 0.1 /100 | #266 | Tragic 43.6% |
| Immigrants | Eritrea | 0.1 /100 | #267 | Tragic 43.6% |
| Spanish American Indians | 0.1 /100 | #268 | Tragic 43.6% |
| Immigrants | Sudan | 0.1 /100 | #269 | Tragic 43.5% |
| Salvadorans | 0.1 /100 | #270 | Tragic 43.5% |
| Bermudans | 0.1 /100 | #271 | Tragic 43.5% |
| Indonesians | 0.1 /100 | #272 | Tragic 43.5% |
| Yaqui | 0.1 /100 | #273 | Tragic 43.4% |
| Nigerians | 0.1 /100 | #274 | Tragic 43.4% |
| Colville | 0.1 /100 | #275 | Tragic 43.4% |
| Sierra Leoneans | 0.1 /100 | #276 | Tragic 43.4% |
| Immigrants | Nigeria | 0.1 /100 | #277 | Tragic 43.4% |
| Central Americans | 0.0 /100 | #278 | Tragic 43.3% |
| Central American Indians | 0.0 /100 | #279 | Tragic 43.3% |
| Apache | 0.0 /100 | #280 | Tragic 43.2% |