Immigrants from Brazil vs Iroquois Currently Married
COMPARE
Immigrants from Brazil
Iroquois
Currently Married
Currently Married Comparison
Immigrants from Brazil
Iroquois
46.6%
CURRENTLY MARRIED
49.9/ 100
METRIC RATING
175th/ 347
METRIC RANK
44.7%
CURRENTLY MARRIED
1.1/ 100
METRIC RATING
234th/ 347
METRIC RANK
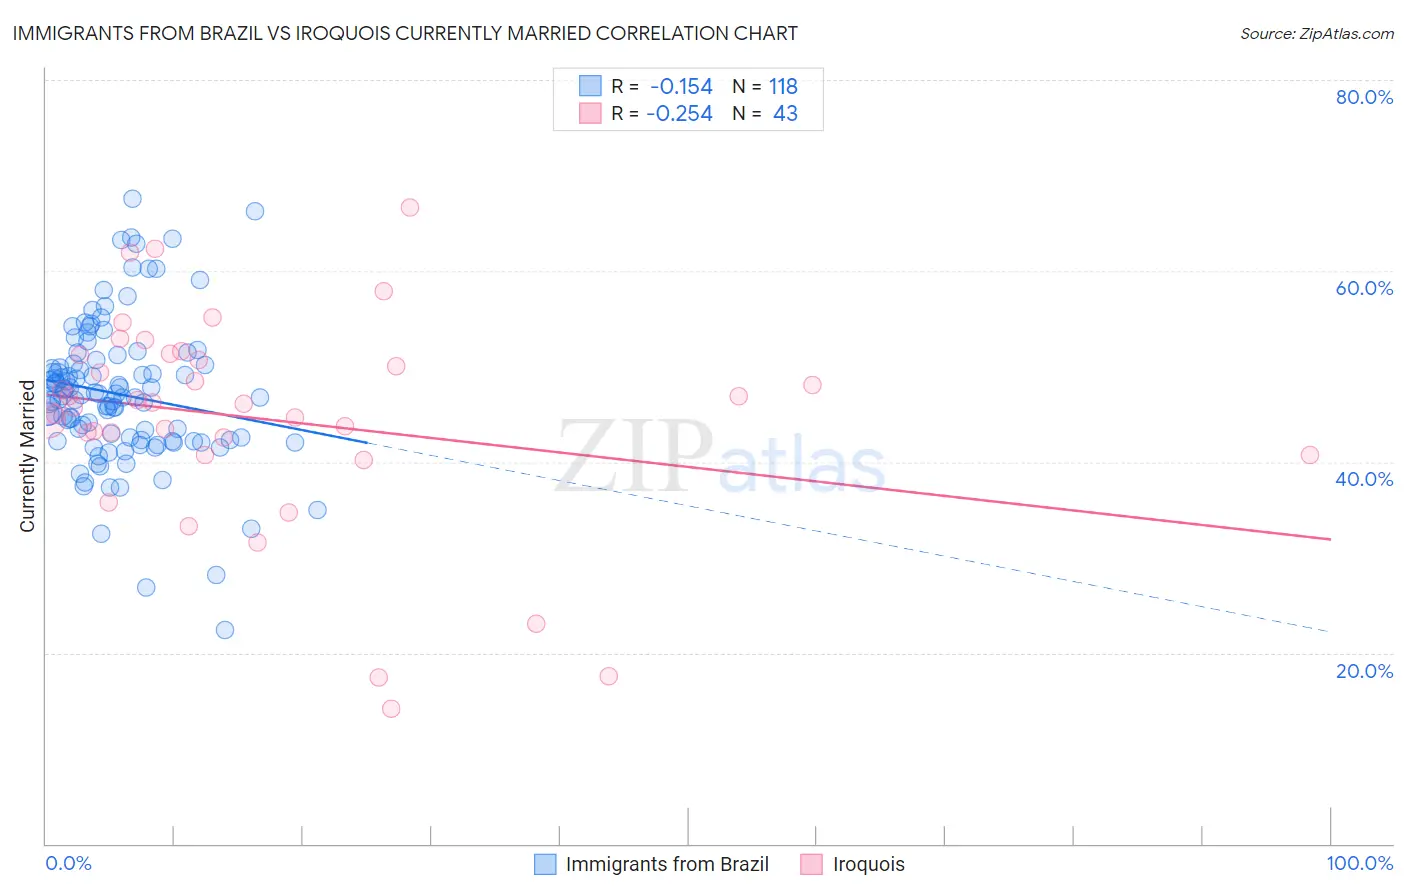
Immigrants from Brazil vs Iroquois Currently Married Correlation Chart
The statistical analysis conducted on geographies consisting of 342,973,445 people shows a poor negative correlation between the proportion of Immigrants from Brazil and percentage of population currently married in the United States with a correlation coefficient (R) of -0.154 and weighted average of 46.6%. Similarly, the statistical analysis conducted on geographies consisting of 207,297,556 people shows a weak negative correlation between the proportion of Iroquois and percentage of population currently married in the United States with a correlation coefficient (R) of -0.254 and weighted average of 44.7%, a difference of 4.3%.
Currently Married Correlation Summary
| Measurement | Immigrants from Brazil | Iroquois |
| Minimum | 22.4% | 14.1% |
| Maximum | 67.6% | 66.7% |
| Range | 45.2% | 52.6% |
| Mean | 47.1% | 44.5% |
| Median | 46.8% | 46.1% |
| Interquartile 25% (IQ1) | 42.3% | 40.7% |
| Interquartile 75% (IQ3) | 50.3% | 51.2% |
| Interquartile Range (IQR) | 8.0% | 10.5% |
| Standard Deviation (Sample) | 7.6% | 11.2% |
| Standard Deviation (Population) | 7.6% | 11.1% |
Similar Demographics by Currently Married
Demographics Similar to Immigrants from Brazil by Currently Married
In terms of currently married, the demographic groups most similar to Immigrants from Brazil are Peruvian (46.6%, a difference of 0.010%), Tlingit-Haida (46.7%, a difference of 0.050%), Hawaiian (46.6%, a difference of 0.050%), Israeli (46.6%, a difference of 0.050%), and Chickasaw (46.6%, a difference of 0.070%).
| Demographics | Rating | Rank | Currently Married |
| Immigrants | Afghanistan | 58.2 /100 | #168 | Average 46.8% |
| Armenians | 58.2 /100 | #169 | Average 46.8% |
| Immigrants | Latvia | 56.7 /100 | #170 | Average 46.7% |
| Immigrants | Zimbabwe | 52.4 /100 | #171 | Average 46.7% |
| Aleuts | 52.0 /100 | #172 | Average 46.7% |
| Tlingit-Haida | 51.2 /100 | #173 | Average 46.7% |
| Peruvians | 50.0 /100 | #174 | Average 46.6% |
| Immigrants | Brazil | 49.9 /100 | #175 | Average 46.6% |
| Hawaiians | 48.6 /100 | #176 | Average 46.6% |
| Israelis | 48.6 /100 | #177 | Average 46.6% |
| Chickasaw | 47.8 /100 | #178 | Average 46.6% |
| Immigrants | Oceania | 44.6 /100 | #179 | Average 46.5% |
| Costa Ricans | 43.7 /100 | #180 | Average 46.5% |
| Ottawa | 43.0 /100 | #181 | Average 46.5% |
| Potawatomi | 41.9 /100 | #182 | Average 46.5% |
Demographics Similar to Iroquois by Currently Married
In terms of currently married, the demographic groups most similar to Iroquois are Immigrants from Saudi Arabia (44.7%, a difference of 0.010%), Nepalese (44.7%, a difference of 0.060%), Alaskan Athabascan (44.6%, a difference of 0.16%), Cuban (44.6%, a difference of 0.16%), and Seminole (44.6%, a difference of 0.17%).
| Demographics | Rating | Rank | Currently Married |
| Spanish Americans | 2.1 /100 | #227 | Tragic 45.0% |
| Immigrants | Uruguay | 2.0 /100 | #228 | Tragic 45.0% |
| Cree | 1.7 /100 | #229 | Tragic 44.9% |
| Immigrants | Kenya | 1.6 /100 | #230 | Tragic 44.9% |
| Immigrants | Panama | 1.5 /100 | #231 | Tragic 44.9% |
| Nepalese | 1.2 /100 | #232 | Tragic 44.7% |
| Immigrants | Saudi Arabia | 1.1 /100 | #233 | Tragic 44.7% |
| Iroquois | 1.1 /100 | #234 | Tragic 44.7% |
| Alaskan Athabascans | 0.9 /100 | #235 | Tragic 44.6% |
| Cubans | 0.9 /100 | #236 | Tragic 44.6% |
| Seminole | 0.9 /100 | #237 | Tragic 44.6% |
| Moroccans | 0.9 /100 | #238 | Tragic 44.6% |
| Immigrants | Mexico | 0.7 /100 | #239 | Tragic 44.5% |
| Mexican American Indians | 0.7 /100 | #240 | Tragic 44.5% |
| Ethiopians | 0.7 /100 | #241 | Tragic 44.5% |